• Understanding Light 14 | The 18-Part Series on Healthy Lighting / Comprehensive Lighting Basics

    Invisible Flicker Is Still Part of Lighting Quality

    Moving from “the eye can’t see it” to measurable temporal light modulation

    Author | Lawrence Lin

    Chairman, GLGA | Board Member, GLG | IWBI WELL Light Concept Advisor | Founder & CEO, LRS

    In a mock-up room, the naked eye cannot see the light flickering, yet a smartphone camera shows black bands across the image. The supplier says, “The phone isn’t professional, so that doesn’t mean there is a problem.” Meanwhile, the user worries that “invisible flicker must damage the brain.” Both statements are too absolute.

    When light output varies over time, this is called temporal light modulation (TLM). It can produce visible flicker, the stroboscopic effect when objects are moving, or the phantom array effect during rapid eye movements. Whether it is perceived or causes discomfort depends on frequency, modulation depth, waveform, luminance, field of view, and the observer.


    A Smartphone Can Provide a Clue, Not a Quantitative Measurement

    A camera’s rolling shutter can amplify or create visible bands. It can therefore be useful for quickly identifying potential issues, but it cannot replace appropriate measurement equipment.

    Rigorous measurement requires a sufficiently high sampling rate, an appropriate photodetector, clearly defined measurement conditions, and analysis of the light-output waveform over time.

    “Flicker percentage” is not a universal metric either. The same modulation depth can produce very different visual effects at different frequencies and with different waveforms. Projects should use evaluation metrics and limits appropriate to the application.


    Dimming Is Often Where Problems Appear

    Many luminaires perform well at rated full power, but temporal light modulation can increase significantly when dimmed to 10% or paired with a different controller. Tunable-white systems can also develop new waveforms when two light sources are mixed.

    Therefore, testing should not be limited to the “best factory condition.”

    Residential nighttime settings, classroom demonstrations, office energy-saving modes, and low-light hotel scenes may all operate in low-dimming ranges—which are precisely the conditions that deserve to be tested.


    Healthy Lighting Cannot Focus Only on Circadian Effects

    If a system uses unstable low-level dimming to reduce nighttime mel-EDI, it may simply exchange one problem for another.

    Integrated design requires the spectrum, luminance, controls, and LED driver to work together as a complete system.


    What We Can Say Today / What We Cannot Yet Say

    What we can say today: Temporal light modulation can be measured and may produce multiple forms of visual artifacts; the driver and dimming state are critical conditions.

    What we cannot say: The absence of visible bands on a smartphone proves “zero flicker,” or that every form of imperceptible modulation causes the same type of health effect.


    Three Things You Can Do Today

    • Measure at 100% output, the typical operating level, and the lowest commonly used dimming level.
    • Test the luminaire, driver, and controller as one complete system.
    • Product documentation should state the measurement method, frequency, waveform, and operating conditions, rather than simply claiming “flicker-free.”

    Evidence label: Established consensus / Open question.
    Standardized methods exist for measuring visual artifacts and some of their effects; broader long-term health effects still require further research.


    References

    • CIE TN 012:2021:https://cie.co.at/publications/guidance-measurement-temporal-light-modulation-light-sources-and-lighting-systems
    • CIE 249:2022:https://www.cie.co.at/publications/visual-aspects-time-modulated-lighting-systems
    • IES TM-18-18:https://store.ies.org/product/tm-18-18-light-and-human-health-an-overview-of-the-impact-of-optical-radiation-on-visual-circadian-neuroendocrine-and-neurobehavioral-responses/

    In the next article, we bring the discussion back to architecture: Daylight, electric light, and controls—which one is truly the protagonist of healthy lighting?

  • Europe’s Lighting Leaders: Where Will the Next Growth Come From?

    Europe’s Lighting Leaders: Where Will the Next Growth Come From?

    Europe’s Lighting Leaders: Where Will the Next Growth Come From?

    By Lawrence Lin
    Founder, Lighting Recipe Studio · Chair, GLGA
    Former Global CEO, LEDVANCE

    European industry perspective · Information cut-off: 7 September 2026

    Europe’s lighting companies have become fluent in explaining difficult markets. Weak construction, deferred investment, price pressure and the contraction of conventional lamps recur throughout their financial commentary. The responses are familiar too: restructuring, simpler organisations, fewer products, asset disposals and leadership changes.

    These pressures are real. Protecting cash and restoring profitability are essential responsibilities. Yet an uncomfortable question remains: can the industry explain its next source of customer value as clearly as it explains its recent decline?

    Europe has built substantial expertise in optics, industrial design, architectural specification and application engineering. That heritage creates an opportunity, and a reasonable expectation of leadership. Customers should be able to see what these capabilities will deliver next—in their buildings, their working environments and their homes.

    The concern is that a mature market can gradually become an excuse for limited ambition. Energy efficiency and environmental responsibility remain indispensable. They cannot, on their own, explain why a customer should choose one competent supplier over another.

    The next phase of growth will depend on meaningful research, better products and reliable delivery. If established lighting businesses do not turn those capabilities into solutions customers value, the brands that organise lighting within intelligent homes and buildings may increasingly come from elsewhere.

    Author’s disclosure: I previously served as Global CEO of LEDVANCE and as Senior Adviser, Asia Pacific, to Zumtobel Group, with the latter appointment ending on 30 June 2026. This article reflects on an industry whose management decisions I have also helped shape. Company assessments below draw on the sources identified in the references.

    Financial resilience is only part of the answer

    Recent results show considerable variation. Some businesses have improved profitability without much revenue growth. Others have expanded into adjacent electrical products, while several major lighting groups have experienced pressure on both sales and margins.

    Business Revenue development Operating profitability What the figures invite us to examine
    Signify €6.704bn in 2023 to €5.765bn in 2025 Adjusted EBITA margin: 10.0% to 8.9% Whether connected products and services can offset the contraction elsewhere
    Zumtobel Group €1.127bn in FY2023/24 to €1.040bn in FY2025/26 Adjusted EBIT margin: 5.1% to 4.1% Different recovery prospects in luminaires and components
    Fagerhult Group SEK8.560bn in 2023 to SEK7.891bn in 2025 Operating margin: 10.5% to 7.7% Whether a broad brand portfolio produces sufficient differentiation and returns
    Luceco £209.0m in 2023 to £271.4m in 2025 Adjusted operating margin: 11.5% to 12.5% How much growth comes from existing operations and how much from acquisitions
    F.W. Thorpe Approximately £175–177m across FY2023–FY2025 Statutory operating margin: approximately 15.8% to 18.3% How specialised delivery and service support profitability

    These are group figures, including international operations and, in some cases, substantial non-lighting activities. Fiscal calendars and profit definitions differ. The table compares each business with its own earlier performance; it is not a ranking of comparable European lighting margins. Sources: the company reporting resources listed below.

    Low growth is not necessarily poor management. A mature business can create considerable value through dependable cash generation and disciplined investment. However, leadership also involves developing future demand. A stronger margin after restructuring is welcome; it does not establish that customers have acquired a new reason to buy.

    Europe needs a broader proposition for light

    For building owners, the relevant decision is often whether an upgrade justifies disruption, installation costs and a long-term maintenance commitment. A more efficient luminaire helps, but the full proposition includes design, compatibility, commissioning, reliability and service.

    Europe’s renovation agenda creates room for that broader offer. The revised Energy Performance of Buildings Directive treats lighting and building automation within the wider performance of technical building systems. The commercial opportunity lies in helping owners achieve workable improvements in existing buildings, where equipment from different generations and suppliers must coexist. [1]

    This calls for practical innovation. Can an installer commission a system more quickly? Can an owner replace a failed component without replacing the entire installation? Can lighting work reliably with other building controls? Can a designer improve visual comfort while retaining flexibility for future changes of use?

    Environmental claims also need to become more tangible. Repairability, durable components, documented material choices and accessible maintenance can influence purchasing decisions when they reduce lifecycle cost or uncertainty. Repeating a general commitment to sustainability provides much less differentiation.

    Price competition deserves the same scrutiny. It can reflect excess capacity and purchasing pressure, but it can also reveal that buyers see too little difference between competing offers. Management cannot control the construction cycle. It can influence whether its products remain interchangeable in the customer’s eyes.

    Signify: a connected installed base still needs an economic case

    Signify illustrates the scale of the transition. Sales fell by approximately 14% between 2023 and 2025, while its adjusted EBITA margin declined from 10.0% to 8.9%. Free cash flow remained substantial: €586m in 2023, €438m in 2024 and €440m in 2025. Cash provides capacity to invest, but it does not remove the growth challenge. [2]

    The reported connected light-point base increased from 124 million in 2023 to 167 million in 2025. This is an important measure of deployment, but a cumulative installed base is not equivalent to recurring revenue or a disclosed number of paying software customers.

    The commercial test is whether connectivity improves retention, supports additional services and produces acceptable returns after development and support costs. The industry needs greater clarity on those outcomes before treating connected volume as proof of a transformed business model.

    Signify’s June 2026 strategy set medium-term ambitions of 0–1% comparable sales growth, approximately 10% adjusted EBITA margin and a 7–8% free-cash-flow margin. Those targets acknowledge a restrained growth environment. They also make the quality of resource allocation especially important. [39]

    As Tempelman’s arrival from the energy sector brings experience relevant to this broader agenda. His appointment creates an opportunity to connect lighting expertise with building and energy requirements. The evidence of success will come from execution, customer adoption and cash returns. [3]

    Zumtobel and Tridonic: two recovery challenges within one group

    Zumtobel’s results show why a group average can obscure the operating task. In FY2025/26, lighting revenue declined by 3.7%, yet adjusted EBIT rose from €51.3m to €54.7m. Components revenue fell by approximately 11%, with adjusted EBIT declining from €13.5m to €4.6m. The two businesses require different responses. [4]

    For professional luminaires, specification, design and application support can help defend value. For components, technical differentiation has to withstand demanding procurement processes and competitive pricing. A driver or control device becomes more valuable when it improves system performance or reduces integration effort; connectivity alone does not ensure pricing power.

    Heiner Lang joined the management board on 1 September 2026 and is scheduled to become CEO on 1 October. His industrial automation background is relevant to the group’s development, while preserving its optical and application knowledge will remain essential. [5]

    First-quarter FY2026/27 sales were €264.1m, down 0.9%, with adjusted EBIT of €8.2m and a 3.1% margin. These results precede the incoming CEO’s tenure and should be assessed accordingly. A leadership transition can establish priorities, but recovery must be demonstrated over subsequent reporting periods. [6]

    Fagerhult, Luceco and F.W. Thorpe: different routes to value

    Fagerhult’s portfolio includes businesses built around architectural specification, local professional markets and infrastructure. Its revenue fell by approximately 7.8% between 2023 and 2025, and operating cash flow declined from SEK1.209bn to SEK740m. Brand breadth has not insulated the group from weaker demand. [7]

    The acquisitions of Trato TLV and Capelon add exposure to specialised applications and connected outdoor lighting. Their strategic logic is understandable. Their long-term value depends on whether they improve customer access and capabilities at a return that justifies the capital invested.

    Multiple brands can preserve local expertise and distinct relationships with specifiers. They can also duplicate costs. The relevant question is whether each business has a clear role and whether shared resources make the portfolio more effective.

    Luceco presents a different picture. Revenue and adjusted operating profitability improved between 2023 and 2025, with free cash flow reaching £30.4m in 2025. Its activities extend across wiring accessories, LED lighting, EV charging and portable power. Acquisitions, including D-Line and CMD, contributed to the expansion. These are the results of a broader electrical-products business, not a measure of organic lighting-market growth. [8]

    Its experience makes adjacency worth studying. Products that share customers, installation channels and engineering capabilities may offer a credible route to expansion. Diversification becomes less convincing when it merely increases the number of separate businesses management must support.

    F.W. Thorpe offers another model. Revenue remained broadly stable across FY2023–FY2025, while statutory operating margins improved. In FY2025, operating cash flow was £33.2m and cash plus short-term financial assets reached £61.8m. [9]

    Thorlux’s offer extends from surveys and design through installation, commissioning and after-sales support. Continued development of SmartScan connects product engineering with the practical operation of installations. This is a concrete example of innovation within an established specialism.

    A useful vision does not require every lighting company to build a universal platform. It can involve doing a demanding application exceptionally well and making the customer’s work easier.

    The private companies complicate the story of decline

    Europe’s lighting industry cannot be understood through a few listed groups alone. Privately owned manufacturers and design businesses reveal different investment choices. Their financial disclosure is often less extensive, so historical scale and current operational developments need to be distinguished.

    TRILUX is a substantial example. DDW lists 2023 revenue of approximately €696.4m, a historical scale reference rather than a current audited performance assessment. More tangible recent evidence comes from the company’s investment programme: a Polish production and development site opened in September 2024 with approximately €32m invested and designed capacity of up to one million luminaires annually. [10] [11]

    In July 2026, TRILUX announced more than €80m of investment over three years at Arnsberg, covering its headquarters and production modernisation. Ansorg and Oktalite had also been brought together within TRILUX Retail. These are identifiable commitments of capital and organisational effort. Their value will depend on utilisation, development efficiency and customer demand, but they make a blanket accusation of industry inactivity difficult to sustain. [12] [13]

    SLV Lighting Group is pursuing integration across a different portfolio. Its predecessor, nnuks, reported turnover above €230m in 2021. That figure establishes historical group scale; it is neither current revenue nor the turnover of the SLV brand alone. [14]

    The group’s 2025 sustainability report describes five brands—SLV, Nordtronic, Novalux, unex lighting and Knightsbridge—and measures to share procurement, logistics and sales capabilities. Nordtronic and SLV are centralising purchasing and logistics, while SLV supports Novalux’s expansion beyond Italy. Knightsbridge also participates in wiring accessories. [15]

    The strategic opportunity is to make a multi-brand group more useful to installers and distributors through availability, range and service. Public disclosure does not yet allow those changes to be translated into a reliable assessment of recent group profitability.

    ERCO demonstrates the importance of application-specific product development. Its 2026 introductions include flexible linear track lighting for offices, further wallwashing applications and developments for display lighting. Those improvements address identifiable design and use requirements. [16]

    Its scale should nevertheless be described cautiously. A business index lists approximately €81.8m for ERCO GmbH in 2024, without sufficiently clarifying the consolidation boundary. The available evidence does not confirm current global brand revenue above €100m. ERCO belongs in the discussion for its professional significance, rather than an assumed revenue threshold. [17]

    FLOS combines an active design programme with the financial complexity of a wider luxury-design group. An Italian company database lists approximately €134.2m of 2024 revenue for FLOS S.p.A.; this is a secondary summary of a legal entity’s accounts, not verified global consolidated FLOS-brand turnover. Product launches continued through the 2025 and 2026 Milan design weeks. [18] [19]

    At Flos B&B Italia Group, the first-half 2026 continuing-business pro forma figures, excluding Louis Poulsen and Fendi Casa, show revenue of €270.2m, down 6.5%, and adjusted EBITDA of €50.1m, down 17.5%. The 18.5% EBITDA margin is a group measure encompassing furniture and other design activities; it must not be attributed to FLOS lighting alone. [20]

    The agreement to sell Louis Poulsen illustrates how ownership and financing influence even highly regarded brands. Announced in June 2026, the transaction was expected to close in the second half, subject to approvals. A disposal can support debt reduction and a new ownership horizon; it does not, by itself, establish that the brand has failed. [21]

    EGLO adds the mass-market decorative-lighting perspective. Its official company profile reports €523m of revenue for 2024 across a portfolio extending beyond lighting alone. Comparable profit and cash-flow figures are not supplied alongside that disclosure. Scale is clear; the quality of recent returns is less visible. [22]

    Specialisation and controls still offer room to grow

    Glamox’s holding company, GLX Holding, reported preliminary 2025 revenue and other operating income of NOK4.447bn, down 0.9%, with adjusted EBITA of NOK680m and a 15.3% margin. Orders increased by 4.9%, while operating cash flow declined from NOK691m to NOK497m. These different movements show why orders, earnings and cash need to be considered together. [23]

    Schréder, whose 2023 turnover was reported at €560m by EY, is extending its outdoor-lighting position through the acquisition of NLS Lighting, announced in April 2026. Local manufacturing and project access in North America provide a plausible complement to its technical capabilities. The transaction price was not disclosed. [24] [25]

    Plejd is a useful counterexample to the assumption that lighting-related markets offer little growth. Its 2025 net sales reached SEK935m, up 41.1%, with an EBIT margin of 24.6%. Management described the growth as organic and identified contributions from adjacent smart products and international expansion. It should therefore be understood as growth in a broader control and installation proposition, not simply stronger demand for luminaires. [26]

    Dexelance’s lighting activities also grew in 2025, reaching €34.3m from €32.1m. This is a smaller segment within a broader design group, but it reinforces the need to examine individual markets rather than assume uniform contraction. [27]

    Turnarounds need equally careful interpretation. Edison’s company-commissioned research on Dialight reports higher group underlying operating profit for the year to March 2026 despite lower revenue. However, lighting-segment revenue and underlying profit before central costs both declined. Improvement elsewhere in a group, or lower overheads, should not automatically be presented as a recovery in lighting demand. [28]

    LEDVANCE and Inventronics: ownership does not remove the European operating challenge

    Europe’s lighting ecosystem includes businesses with international ownership, engineering teams, manufacturing and customers. Their strategic significance rests on what they deliver in European markets.

    LEDVANCE retains substantial brand recognition, distribution relationships and local operating capabilities. Its parent’s product-line disclosure reports 2025 revenue of RMB9.25bn and a gross margin of approximately 40%. These are worldwide product figures reported in the parent’s currency, not European regional revenue or a standalone operating margin. [29]

    The first half of 2026 illustrates the importance of that distinction. LEDVANCE product-line revenue was RMB4.326bn, down 1.12%, while its gross margin fell to 39.82%, a decline of 2.80 percentage points. Gross profit decreased by approximately RMB142m. The parent group’s profit recovery therefore cannot establish a recovery in LEDVANCE’s lighting operations. Separate product-line net profit and cash flow were not disclosed. [30]

    Large acquisition-related impairments in the parent’s 2025 accounts also require care: a reduction in the carrying value of an acquisition-related asset group is not an equivalent amount of annual operating loss at LEDVANCE GmbH.

    For European customers, the more immediate questions concern product development, service and project execution. The acquisition of loblicht adds professional project capabilities. LEDVANCE’s August 2026 management announcement emphasised European B2B and project activity, alongside more efficient customer processes. [31]

    Its renewables range raises a further strategic question. Lighting, photovoltaics, inverters and storage can share some channels and customers, but commercial synergies need evidence. Public product availability does not establish material revenue or acceptable returns. [32]

    Inventronics faces a related task following its acquisition of the former ams OSRAM digital-systems business in Europe and Asia. The acquisition brought engineering, products and customer relationships, but those assets still have to earn their returns. Its subsequent transition from licensed OSRAM branding to Inventronics increases the importance of its own product reputation and service continuity. [38] [38] [38]

    For both businesses, the European test is practical: customer retention, competitive technical performance, reliable availability and profitable execution. Ownership changes and portfolio expansion can support those outcomes; they cannot substitute for them.

    IKEA and Kingfisher: the customer relationship is already broader than lighting

    The industry’s future competitors need not begin as specialist luminaire manufacturers. Home-furnishing and home-improvement businesses can place lighting inside a purchase journey customers already understand.

    IKEA reported worldwide retail sales of €44.6bn in FY2025, down approximately 1%, while volumes and customer numbers increased by around 3% following price reductions. These figures cover the whole IKEA retail system, including non-lighting activities; they say nothing directly about lighting profitability. [33]

    More significant for lighting strategy was IKEA’s November 2025 announcement of 21 Matter-compatible smart-home products, including 11 KAJPLATS bulbs, sensors and remotes. Its proposition brings connected lighting into an accessible home-furnishing context. [34]

    The competitive implication is an inference from that offer: a retailer that helps people choose, install and use a system can become the brand associated with the experience, while individual device suppliers become less visible. Product launches alone do not establish that IKEA has achieved this at scale or profitably.

    Kingfisher offers another view of channel influence. In the year ended 31 January 2026, group sales were £12.945bn and adjusted pre-tax profit £560m. B&Q sales reached £3.971bn, with like-for-like growth of 3.3%. Own exclusive brands represented 43% of group sales across categories, including ranges such as GoodHome and LAP. That percentage is not a lighting-market share. [35] [36]

    The next quarter was less favourable for B&Q: sales fell 3% as reported and 4.1% like for like, although e-commerce grew. Channel ownership does not eliminate exposure to household spending and renovation cycles. [37]

    Neither IKEA nor Kingfisher provides enough separate lighting information here to compare its lighting profitability with manufacturers. Their strategic relevance is nevertheless clear: they influence assortment, price, convenience and the customer relationship. Lighting brands need to demonstrate what additional value they bring within that environment.

    Leadership requires a commitment that customers can recognise

    The evidence does not support a claim that European lighting companies have stopped innovating. TRILUX’s investments, ERCO’s application work, F.W. Thorpe’s systems and service, and Plejd’s expansion all provide concrete counterexamples.

    The sharper concern is whether those efforts are sufficient, sustained and commercially effective. Research expenditure alone cannot answer this. Companies differ in their development cycles, accounting policies and mix of software, electronics and optical engineering.

    A credible vision should identify the customer problem, the resources committed and the conditions that will determine success. For a building owner, that might mean lower lifecycle cost and more dependable maintenance. For an installer, less commissioning time and fewer callbacks. For a specifier, better visual performance and clearer integration choices. For a household, an intuitive system that continues to work as devices change.

    Claims about wellbeing should be tied to measured lighting conditions and appropriate evidence. A controllable spectrum or a new product label does not establish a health outcome. Professional credibility depends on communicating what has actually been demonstrated.

    Boards also need to examine what restructuring preserves. Repeatedly reducing application engineering, software support and customer knowledge may protect current earnings while weakening the next product generation. Long-term projects require milestones and accountability, but they also require continuity.

    Europe’s strongest opportunity is to connect its existing expertise with the realities of occupied buildings. That involves partnerships with electrical, automation and building-service businesses; clearer responsibility for commissioning and maintenance; and products designed to remain useful within evolving systems.

    Traditional lighting manufacturers still have substantial advantages in optical performance, specification and application knowledge. New entrants have their own execution gaps. The eventual outcome is open.

    What should concern established leaders is the possibility of remaining technically capable while becoming commercially secondary—supplying devices into systems whose customer relationships and service revenues belong to someone else.

    The next generation of European lighting leadership will be earned through products and services that people can recognise as better, supported by investment that produces durable returns. The question for today’s leaders is whether their current decisions are building that future.

    Sources and reading notes

    The references distinguish company financial reports, product announcements and secondary scale estimates. Product and investment announcements establish actions or intentions, not proven financial returns. Figures retain their original currencies and reporting periods; group, brand, legal-entity and product-line disclosures are not interchangeable.

    For readers using a platform that does not support external links, copy the full address below into a browser. Some financial-report links open PDFs; long addresses should be copied in full.

    [1] EU Energy Performance of Buildings Directive
    Regulatory context for technical building systems; implementation and scope depend on the relevant provisions.
    https://eur-lex.europa.eu/eli/dir/2024/1275/oj

    [2] Signify reporting and announcements
    Company reporting archive; annual results supply the historical group figures.
    https://www.signify.com/global/our-company/news/press-releases

    [3] Signify: CEO appointment
    Background and timing of As Tempelman’s appointment.
    https://www.signify.com/global/our-company/news/press-releases/2025/20250528-signify-names-as-tempelman-as-chief-executive-officer

    [4] Zumtobel Group corporate information
    Company reporting and announcements; group and segment measures must be distinguished.
    https://z.lighting/en/group/investor-relations/

    [5] Zumtobel: Heiner Lang appointment
    Board entry and planned CEO succession dates.
    https://z.lighting/en-gb/group/news-insights/ir/supervisory-board-appoints-heiner-lang-ceo-zumtobel-group/

    [6] Zumtobel Q1 FY2026/27 results
    Quarterly figures preceding the incoming CEO’s tenure.
    https://z.lighting/documents/4085/Zumtobel_Group_-Press_releases-_Q1_2026-27.pdf

    [7] Fagerhult investor information
    Annual reporting, portfolio and acquisition information.
    https://www.fagerhultgroup.com/investors/

    [8] Luceco investor information
    Group reporting includes electrical products beyond lighting.
    https://www.lucecoplc.com/investors/

    [9] F.W. Thorpe annual report 2025
    Financial results, SmartScan and operating model.
    https://www.fwthorpe.co.uk/pdf/fw-thorpe-annual-report-2025.pdf

    [10] TRILUX company profile, DDW
    Secondary historical revenue estimate for 2023.
    https://die-deutsche-wirtschaft.de/unternehmen/trilux-gmbh-co-kg-arnsberg/

    [11] TRILUX sustainability report 2023/24
    Polish facility investment and capacity; pages 36–37.
    https://www.trilux.com/fileadmin/Downloads/Documents/Nachhaltigkeit/Sustainability_Report_2023-2024.pdf

    [12] TRILUX Arnsberg investment announcement
    Planned investment over three years, announced July 2026.
    https://www.trilux.com/de/blog/neubau-standort-arnsberg/

    [13] TRILUX Retail integration
    Brand and organisational changes.
    https://www.trilux.com/ch/blog/trilux-retail-migration/

    [14] nnuks sustainability report 2022
    Historical 2021 multi-brand group turnover.
    https://slv-lighting-group.com/wp-content/uploads/2022/06/NKS_BRO_Sustainability-2022_210x279.pdf

    [15] SLV Lighting Group sustainability report 2025
    Brand portfolio and procurement, logistics and sales integration; pages 8–11.
    https://a.storyblok.com/f/113144/x/f85bebdba1/slg_bro_sustainability-2025_210x279mm_72dpi.pdf

    [16] ERCO new products
    Application and product information; not financial evidence.
    https://www.erco.com/en/products/new-products/

    [17] ERCO business-index profile
    Secondary legal-entity figure with an unclear consolidation boundary.
    https://www.weltmarktfuehrerindex.de/profil/erco

    [18] FLOS S.p.A. company-account summary
    Secondary transcription of legal-entity accounts, not global brand revenue.
    https://www.reportaziende.it/flos_societa_per_azioni_bs_00290820174

    [19] FLOS at Milan Design Week 2026
    Product-development evidence.
    https://flos.com/en/wo/flos-at-milano-design-week-2026.html

    [20] Flos B&B Italia Group H1 2026 presentation
    Continuing-business pro forma results, pages 5 and 12; includes non-lighting businesses.
    https://www.flosbebitaliagroup.com/on/demandware.static/-/Library-Sites-DHCorp-contentlib/default/dw8ee7cc40/Investors/Reports%20and%20publications/1_presentation_Flos%20B%26B%20Italia%20S.p.A.%20-%20H1%202026_last.pdf

    [21] Louis Poulsen transaction: buyer’s adviser
    Announced transaction subject to completion conditions.
    https://accura.dk/en/cases/chr-augustinus-fabrikker-acquires-louis-poulsen/

    [22] EGLO official company profile
    Self-reported 2024 scale; no matching profit or cash-flow disclosure.
    https://lu.linkedin.com/company/eglo-leuchten-gmbh

    [23] GLX Holding preliminary 2025 results
    Holding-company reporting scope and preliminary results.
    https://www.glamox.com/news-and-stories/glx-holding-as-the-holding-company-of-glamox-closes-2025-with-improved-profitability-and-robust-performance/

    [24] EY profile of Schréder
    Historical 2023 turnover, published December 2024.
    https://www.ey.com/en_be/newsroom/2024/12/schreder-named-l-entreprise-de-l-annee-2024

    [25] Schréder acquisition of NLS Lighting
    Announced April 2026; price not disclosed.
    https://www.schreder.com/en/news/schreder-announces-acquisition-nls-lighting

    [26] Plejd year-end report 2025
    Reported growth, profitability and management explanation of organic expansion.
    https://news.cision.com/plejd/r/year-end-report-2025,c4296913

    [27] Dexelance investor presentation, April 2026
    Lighting-segment revenue, page 25.
    https://dexelance.com/wp-content/uploads/Investor-Presentation-DEXELANCE_v.-08.04.2026-FINAL-1.pdf

    [28] Edison research on Dialight
    Company-commissioned external research; group and lighting-segment results on pages 3–4.
    https://static.lse.co.uk/research/download/3653.pdf

    [29] MLS annual report 2025
    Listed parent’s product-line and acquisition-accounting disclosures, in Chinese.
    https://money.finance.sina.com.cn/corp/view/vCB_AllBulletinDetail.php?id=12234150&stockid=002745

    [30] MLS interim report 2026
    Product-line gross profit and consolidated group results, in Chinese.
    https://money.finance.sina.com.cn/corp/view/vCB_AllBulletinDetail.php?id=12563625&stockid=002745

    [31] LEDVANCE management announcement, August 2026
    Management responsibilities and European operating priorities.
    https://www.ledvance.com/en-uk/company/press/press-releases/2026/ledvance-strengthens-its-management-team-with-dr-markus-emmert-n479050

    [32] LEDVANCE Renewables announcement
    Product range and stated strategy, not separate financial results.
    https://www.ledvance.com/en-int/company/press/press-releases/2024/ledvance-introduces-ledvance-renewables–photovoltaics-for-a-brighter–greener-future-n303994

    [33] IKEA FY2025 retail sales
    Worldwide retail-system figures, not lighting-segment results.
    https://www.ikea.com/global/en/newsroom/corporate/ikea-retail-sales-fy25-251016/

    [34] IKEA smart-home product announcement
    November 2025 Matter-compatible range.
    https://www.ikea.com/global/en/newsroom/retail/the-new-smart-home-from-ikea-matter-compatible-251106/

    [35] Kingfisher annual report 2025/26
    Group and B&Q financial results; fiscal year ended January 2026.
    https://www.kingfisher.com/~/media/Files/K/Kingfisher-Plc/Universal/investors/result-reports-presentation/2026/2526-annual-report-and-accounts.pdf

    [36] Kingfisher own exclusive brands
    43% relates to group sales across categories, not lighting alone.
    https://www.kingfisher.com/our-banners-and-brands/own-exclusive-brands

    [37] Kingfisher Q1 2026/27 update
    Quarter ended April 2026; separate period from annual results.
    https://www.kingfisher.com/~/media/Files/K/Kingfisher-Plc/Universal/investors/result-reports-presentation/2026/2026-27-q1-trading-update.pdf

    [38] Inventronics annual reporting and acquisition information
    Company disclosures concerning acquired operations and subsequent performance; source in Chinese.
    https://cn.inventronics-co.com/news_info/33/1771.html

    [39] Signify strategy announcement, June 2026
    Medium-term growth, profitability and cash-flow targets are management objectives, not reported outcomes.
    https://www.signify.com/global/our-company/news/press-releases/2026/20260623-signify-introduces-strategy-to-create-a-more-focused-better-performing-company

  • Understanding Light 13 | The 18-Part Series on Healthy Lighting / Comprehensive Lighting Basics

    “Blue Light”: Risk, Circadian Signal, or Marketing Buzzword?

    Behind the same term are actually three completely different questions.

    Author | Lawrence Lin

    Chairman, GLGA | Board Member, GLG | IWBI WELL Light Concept Advisor | Founder & CEO, LRS

    Consumers sometimes ask me about “blue-light protection” lighting: “If blue light is harmful, why do we also want to increase melanopic stimulation during the day?” This is not a contradiction. Rather, the industry has long used the single term “blue light” to describe three different concepts.

    Blue-light hazard, circadian-related stimulation, and visual fatigue need to be discussed separately. Their wavelength ranges may overlap, but their mechanisms, doses, evaluation methods, and risk contexts are different.


    Blue-Light Hazard: Photochemical Retinal Damage

    The blue-light hazard defined by CIE specifically refers to the risk of photochemical retinal injury, evaluated using the relevant hazard weighting function together with radiance/irradiance. It is not the same as an effect on sleep, nor is it the same as “feeling tired from looking at a screen.”

    Under foreseeable normal-use conditions, ordinary white-light illumination generally does not constitute a blue-light hazard.

    High-intensity specialized light sources, close-range viewing, or specific industrial environments still need to be evaluated according to requirements such as IEC 62471. The above conclusion should not be used to rule out every situation.


    Circadian-Related Stimulation: Timing and Exposure Matter

    The melanopsin pathway is relatively sensitive to short-wavelength visible light, but it should be described using the melanopic metrics defined in CIE S 026, rather than simply saying that there is “more blue light.”

    Appropriate light exposure during the day and reduced exposure at night are time-based strategies. They should not be substituted with blue-light-hazard classifications.

    Likewise, reducing the impact of screens at night is not simply a matter of putting a yellow filter over the display. Brightness, viewing distance, exposure duration, psychologically stimulating content, and the lighting of the entire room all matter.


    Visual Fatigue: Often Not a Wavelength Problem

    Dry eyes, reduced blinking, text that is too small, reflective glare, prolonged close-up viewing, and posture can all contribute to discomfort.

    Blaming all visual fatigue on blue light can cause genuinely effective interventions to be overlooked.

    A responsible “low-blue-light” product should explain which part of the spectrum has been reduced, what color performance has been sacrificed, which time periods the product is intended for, and which testing methods support the claim.


    What We Can Say Today / What We Cannot Yet Say

    What we can say today: Blue-light hazard has a specific photobiological safety definition; melanopic stimulation has its own measurement framework; and visual fatigue is a multifactorial issue.

    What we cannot say: Blue light in ordinary white-light illumination necessarily damages the retina, or that removing blue light automatically solves sleep problems or visual fatigue.


    Three Things You Can Do Today

    • When you hear the term “blue light,” first ask whether the discussion concerns photobiological safety, circadian effects, or visual comfort.
    • For specialized high-intensity light sources, use the IEC 62471 series for risk classification rather than substituting a marketing label.
    • At night, prioritize reducing overall brightness and exposure duration, and then optimize the spectrum.

    Evidence label: Established consensus.
    These three questions should be measured and communicated separately.


    References

    • CIE Position Statement on Blue Light Hazard :https://cie.co.at/publications/position-statement-blue-light-hazard-april-23-2019
    • IEC 62471-7:2023 :https://webstore.iec.ch/en/publication/68810
    • CIE S 026:2018 :https://www.cie.co.at/publications/cie-system-metrology-optical-radiation-iprgc-influenced-responses-light-0

    In the next article, we look at another issue often dismissed with the phrase “flicker-free”: Why can invisible flicker still affect lighting quality?

  • Understanding Light 12 | The 18-Part Series on Healthy Lighting / Comprehensive Lighting Basics

    Full-Spectrum Does Not Equal Healthy, and Color Temperature Is Not a Cure-All

    Bringing the spectrum back to measurable characteristics instead of asking it to carry promises beyond the evidence

    Author | Lawrence Lin

    Chairman, GLGA | Board Member, GLG | IWBI WELL Light Concept Advisor | Founder & CEO, LRS

    “We use a full-spectrum light source, so it’s better for your eyes, helps you sleep, and is closer to natural daylight.” This kind of marketing language is common. “Full spectrum” sounds complete and natural, which makes it particularly easy to attach claims that go beyond the available evidence.

    At present, “full spectrum” is not a standardized prescription that automatically corresponds to specific health outcomes in market communications. To evaluate a light spectrum, we should return to specific measurable metrics: color rendering, gamut, distribution across specific wavelength bands, mel-DER, and overall performance under different operating conditions.


    Continuous Does Not Mean Suitable for Every Time of Day

    A seemingly continuous and smooth spectrum may provide a pleasant color experience, but whether it is appropriate for a morning office, an evening residence, or museum display still depends on quantity, direction, timing, and the people exposed to it.

    Daylight itself is not a fixed spectral curve. It changes with weather, time of day, orientation, and sky conditions.

    Without specifying the conditions of comparison, saying that a light source is “like daylight” is difficult to turn into a rigorous conclusion. Moreover, the goal before bedtime is not to reproduce midday sunlight, but to reduce unnecessary light exposure.


    CCT Cannot Replace the Spectrum

    Two 3000 K light sources can have different levels of color fidelity, gamut, and mel-DER.

    Conversely, a 4000 K product that has been appropriately dimmed may result in lower mel-EDI at the eyes than an undimmed 2700 K product.

    Color temperature affects color appearance and atmosphere, but it is not a physiological dose.

    Color quality should also not be evaluated solely through the general color rendering index Ra. CIE has recommended that, during the transition period, CIE Rf and Ra be reported together. If a project is concerned with color preference and colorfulness, more complete gamut and hue information is also needed.


    What Should You Ask When Comparing Products?

    Request machine-readable spectral data, rather than just images or marketing graphics.

    Confirm that the data correspond to the specified power level, color temperature, and dimming setting.

    Check whether color fidelity, gamut, mel-DER, efficiency, and temporal light modulation are all acceptable at the same time.

    If a supplier claims that a product improves sleep or cognition, ask about the population studied, the exposure scenario, and the duration of the human study.

    A truly professional product is not afraid to clearly state its boundaries.


    What We Can Say Today / What We Cannot Yet Say

    What we can say today: The shape of the spectrum affects color appearance and α-opic stimulation; complete spectral data have greater engineering value than a “full-spectrum” label.

    What we cannot say: A continuous spectrum, a CCT close to daylight, or a high Ra value automatically means that a product is better for the eyes, improves sleep, or is suitable for all-day use.


    Three Things You Can Do Today

    • Replace the term “full spectrum” with verifiable spectral, color, and α-opic metrics.
    • When comparing dimmable and tunable products, evaluate every critical scenario, rather than only the rated operating condition.
    • When communicating with consumers, clearly distinguish between “natural appearance / accurate color” and “medical or health outcomes.”

    Evidence label: Established consensus / Open question.
    The spectrum can be accurately measured; there is no automatic equivalence between a single market label and long-term health outcomes.


    References

    • CIE PS 002:2025 :https://www.cie.co.at/publications/cie-ps-0022025-cie-position-statement-colour-quality-metrics-2nd-edition
    • CIE S 026:2018 :https://www.cie.co.at/publications/cie-system-metrology-optical-radiation-iprgc-influenced-responses-light-0
    • CIE 253:2024 — Technical Reports :https://cie.co.at/publications/technical-reports

    In the next article, we continue unpacking another term that easily triggers anxiety: Is blue light actually a risk, a circadian signal, or simply a marketing buzzword?

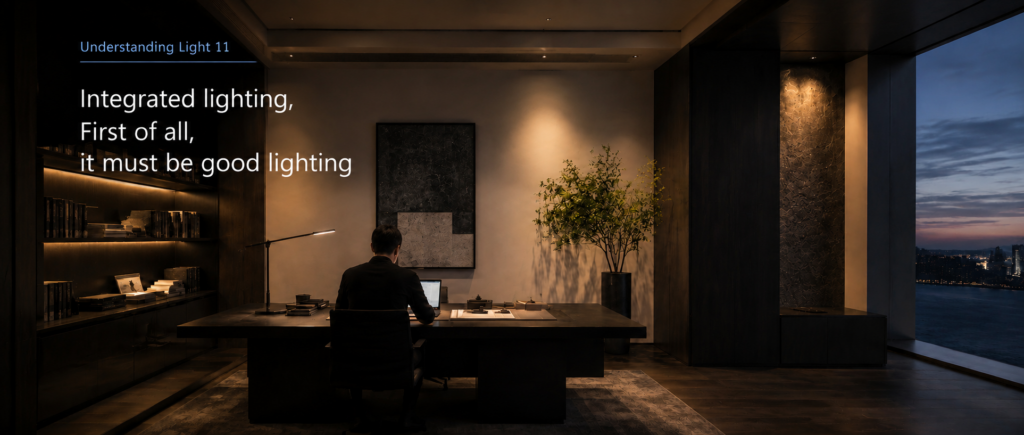
  • Understanding Light 11 | The 18-Part Series on Healthy Lighting / Comprehensive Lighting Basics

    Integrated Lighting Must First and Foremost Be Good Lighting

    Without visual quality, no health-related objective can stand on solid ground.

    Author | Lawrence Lin

    Chairman, GLGA | Board Member, GLG | IWBI WELL Light Concept Advisor | Founder & CEO, LRS

    An office once added a very bright luminous surface directly in front of employees in an effort to increase light exposure at the eyes. The measured numbers looked excellent, but employees began wearing hats, turning off the lights, and even blocking the light with cardboard. The design achieved its calculated target—but lost its users.

    Integrated lighting is not about adding another number on top of conventional lighting. It must first satisfy visibility, comfort, safety, and spatial quality, and only then address appropriately timed non-visual stimulation. A lighting scheme that people actively try to escape from is unlikely to deliver its intended benefits over the long term.


    The Non-Negotiable Foundations of Good Lighting

    Illuminance should be appropriate to the task, and its distribution should not force the eyes to repeatedly adapt between extremely bright and extremely dark areas. Glare must be controlled, and screens and glossy surfaces should not produce distracting reflections. Color rendering should support the recognition of people, materials, and warning information. Temporal light modulation should not create noticeable flicker or stroboscopic effects.

    The space also needs hierarchy. Uniformity does not mean making every surface equally bright, and dynamic lighting does not mean changing the color temperature every ten minutes. Human attention, orientation, and the atmosphere of a space often come from orderly relationships between different luminance levels.


    The Metrics Need to Be Balanced

    Increasing vertical illuminance may increase glare; increasing wall luminance may increase energy consumption; changing the spectrum may affect color rendering and system efficiency; excessive dimming may amplify temporal light modulation from certain drivers.

    The value of engineering design lies precisely in finding the overall optimum within these constraints, rather than pursuing a single metric as the “champion.”

    This is also the full meaning of what CIE describes as “proper light at the proper time”: the right light is not defined only by quantity and timing, but also by quality and the environment in which it is used.


    User Behavior Is One of the Final Judges

    If users frequently pull the curtains, disable automatic controls, or block luminaires, the first step should be to understand why.

    Glare, temperature, privacy, screen reflections, or control logic can all cause the original design intent to fail. Post-occupancy feedback is not a soft bonus—it is evidence of whether the system actually works.


    What We Can Say Today / What We Cannot Yet Say

    What we can say today: Integrated lighting should simultaneously address visual comfort, task performance, safety, circadian-related objectives, energy, and building conditions.

    What we cannot say: Achieving a particular melanopic value justifies sacrificing glare control, color rendering, flicker control, or user autonomy.


    Three Things You Can Do Today

    • Establish a combined checklist covering illuminance, glare, color rendering, temporal light modulation, controls, and mel-EDI.
    • During mock-up testing, have real users sit, look, and perform tasks—not just let instruments take measurements.
    • After acceptance, conduct a follow-up and observe “anti-design behaviors” such as blocking lights, turning lights off, or pulling curtains.

    Evidence label: Established consensus.
    The foundation of integrated lighting is meeting the requirements of overall lighting quality.


    References

    • CIE PS 001:2024: https://cie.co.at/publications/cie-position-statement-integrative-lighting-recommending-proper-light-proper-time-3rd
    • ISO/CIE 8995-1:2025: https://www.iso.org/standard/76342.html
    • GB/T 50034—2024 Publication Information: https://sczjjgfw.gov.cn/clas/wjhb/jsb/24/jsb202433.html

    In the next article, we tackle one of the loudest terms in the market: Why doesn’t “full spectrum” automatically mean healthy, and why isn’t color temperature a cure-all?

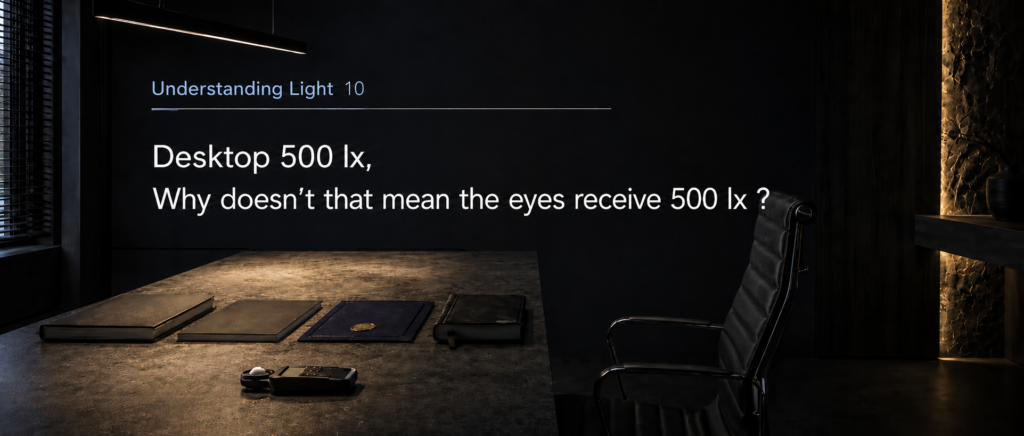
  • Understanding Light 10 | The 18-Part Series on Healthy Lighting / Comprehensive Lighting Basics

    A Desktop Reading of 500 lx—Why Doesn’t That Mean the Eyes Receive 500 lx?

    Only when we move from horizontal illuminance to the direction of human vision does the space truly enter the calculation.

    Author | Lawrence Lin

    Chairman, GLGA | Board Member, GLG | IWBI WELL Light Concept Advisor | Founder & CEO, LRS

    During final acceptance testing, an engineer places the illuminance meter flat on the desktop and gets a reading of 512 lx. Everyone breathes a sigh of relief. But once seated, the user is facing a dark wall, a bright window, and reflections from the screen. A compliant desktop reading does not necessarily mean that the visual experience or the light exposure at the eyes is also satisfactory.

    Horizontal illuminance is an important basis for evaluating the work surface; vertical illuminance at eye level and mel-EDI describe a different geometric direction. They may be related, but they cannot substitute for one another.


    Where the Light Goes Depends on the Distribution and the Surfaces

    A narrow-beam downlight can concentrate a large amount of light onto the desktop while sending relatively little light into the user’s forward field of view. Large luminous surfaces, bright walls, or side windows, by contrast, can increase illuminance in the direction of the eyes. The reflectance of walls, ceilings, and floors, as well as furniture height, partitions, and curtain positions, can all change the final result.

    Therefore, the same 500 lx of desktop illuminance can correspond to completely different vertical illuminance, luminance distributions, and glare risks. If the design software contains only a horizontal calculation plane, these differences can be difficult to identify in advance.


    How Should Eye-Level Measurement Points Be Defined?

    In office environments, vertical measurement points are commonly established at seated eye height and calculated or measured along the primary viewing direction. For standing environments, classrooms, patient rooms, and transportation spaces, the measurement setup should be adjusted according to the actual posture. If the direction people face is not fixed, multiple representative directions can be selected, or both typical and worst-case conditions can be evaluated.

    When measuring mel-EDI, the sensor must have an appropriate spectral response and be maintained in the vertical orientation. Taking a reading with a conventional illuminance meter and then estimating the result based on color temperature can introduce uncontrolled errors. On-site measurements should also document daylight conditions, curtain position, luminaire dimming, and measurement time.


    One Continuous Line from Drawings to the Site

    During the design stage, establish both horizontal work-plane calculation surfaces and vertical eye-level planes in the model.

    During the mock-up stage, use a spectrometer to verify conditions at the predetermined eye positions.

    During commissioning, check daytime, dusk, and nighttime scenarios.

    During final acceptance, repeat the measurements using the same measurement-point checklist.

    If each of these four stages uses different locations and conditions, even highly precise numbers cannot form a reliable chain of evidence.


    What We Can Say Today / What We Cannot Yet Say

    What we can say today: Horizontal desktop illuminance primarily serves the evaluation of visual tasks; vertical measurements at eye level are better suited to describing the light exposure in the direction of a person’s view. The two should be evaluated in parallel.

    What we cannot say: A horizontal illuminance of 500 lx necessarily corresponds to a fixed mel-EDI value, or that a high vertical illuminance automatically means good visual comfort.


    Three Things You Can Do Today

    • Mark both the work plane and representative eye-level measurement points on the drawings.
    • Record the direction, time, curtain position, daylight conditions, and dimming state during on-site measurements.
    • Review glare, luminance distribution, and vertical light exposure together within the same lighting scenario.

    Evidence label: Established consensus.
    Measurement geometry is part of the result; it cannot be omitted.


    References

    • CIE S 026:2018:https://www.cie.co.at/publications/cie-system-metrology-optical-radiation-iprgc-influenced-responses-light-0
    • Brown et al., 2022:https://journals.plos.org/plosbiology/article?id=10.1371/journal.pbio.3001571
    • ISO/CIE 8995-1:2025:https://www.iso.org/standard/76342.html

    In the next article, we will temporarily step away from new metrics and return to the most fundamental principle: Integrated lighting must first and foremost be good lighting.

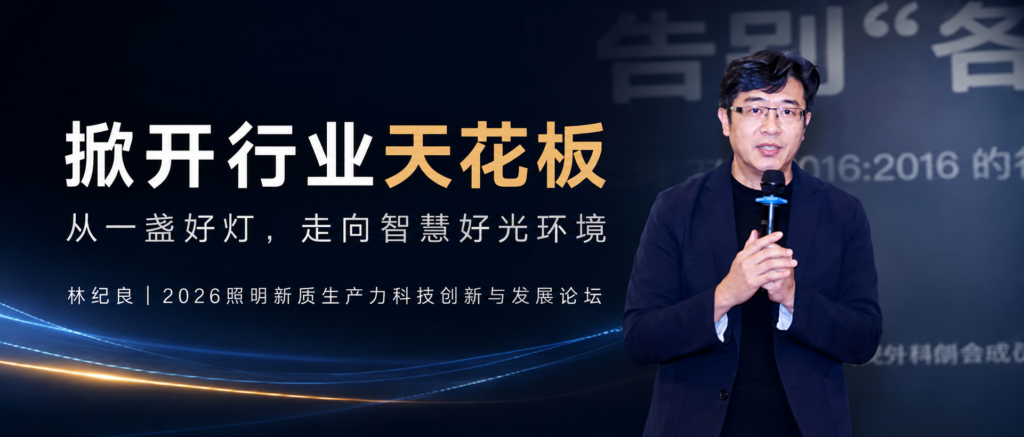
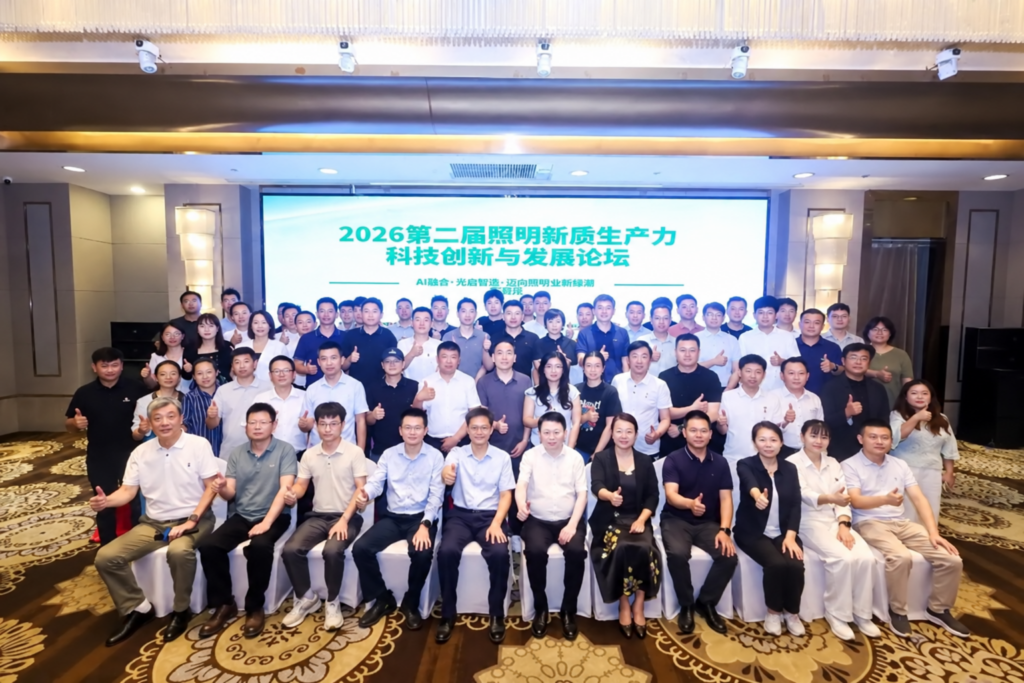
  • 2026 Second Forum on New Quality Productive Forces, Technological Innovation and Development in Lighting

    Artificial Electric Light Has Come a Long Way in Nearly 150 Years—How Do We Break Through the Ceiling of the Lighting Industry?

    Lawrence Lin
    Founder, Lighting Recipe Studio (LRS)
    Chairman, Good Light Group Asia (GLGA)

    September 3, Nanchang.

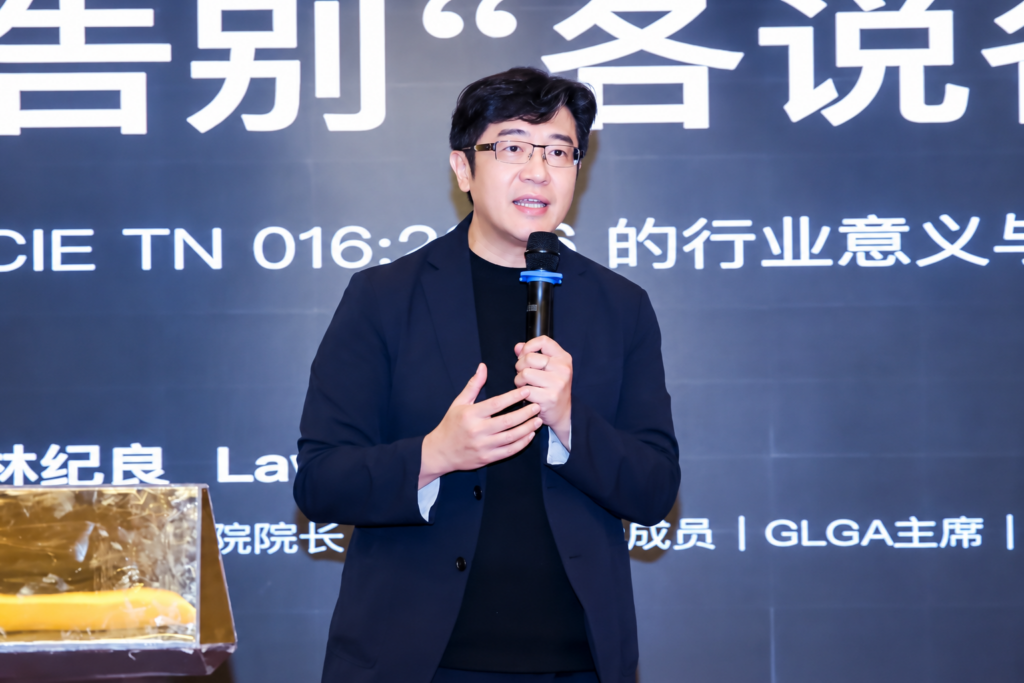
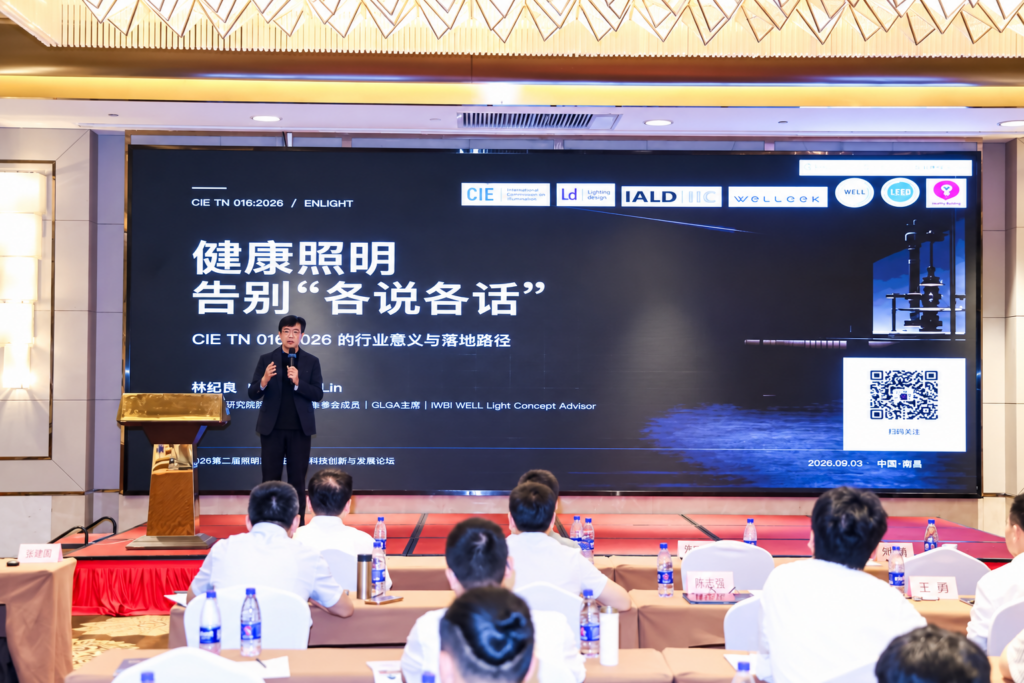
    At the 2026 Second Forum on New Quality Productive Forces, Technological Innovation and Development in Lighting, Lawrence delivered a morning presentation titled “Beyond Talking Past One Another in Healthy Lighting — The Industry Significance and Implementation Pathway of CIE TN 016:2026.”

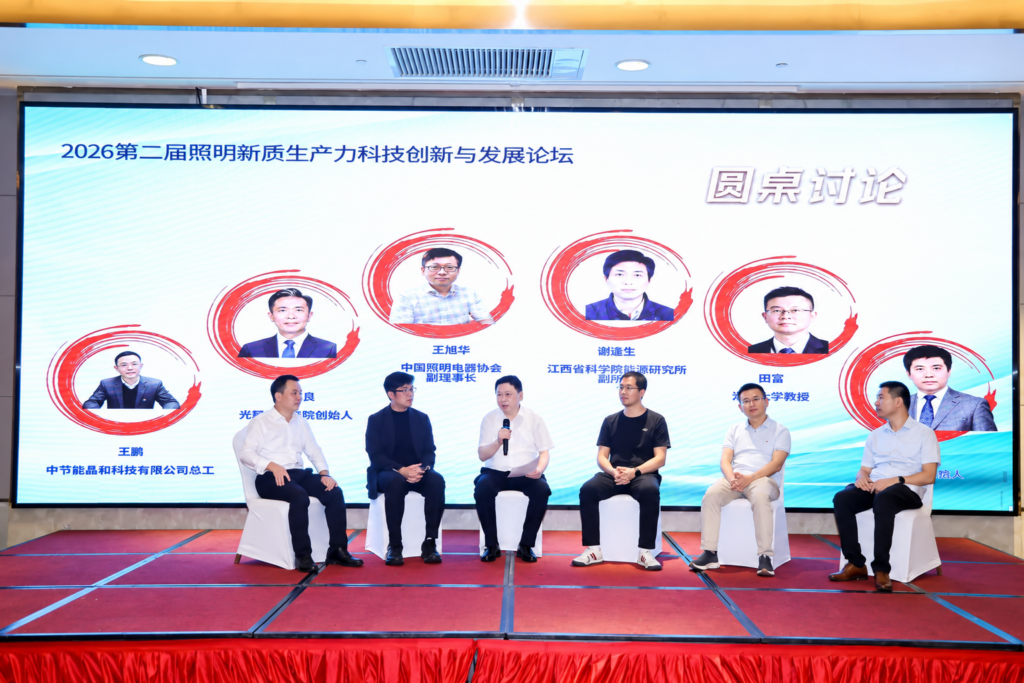
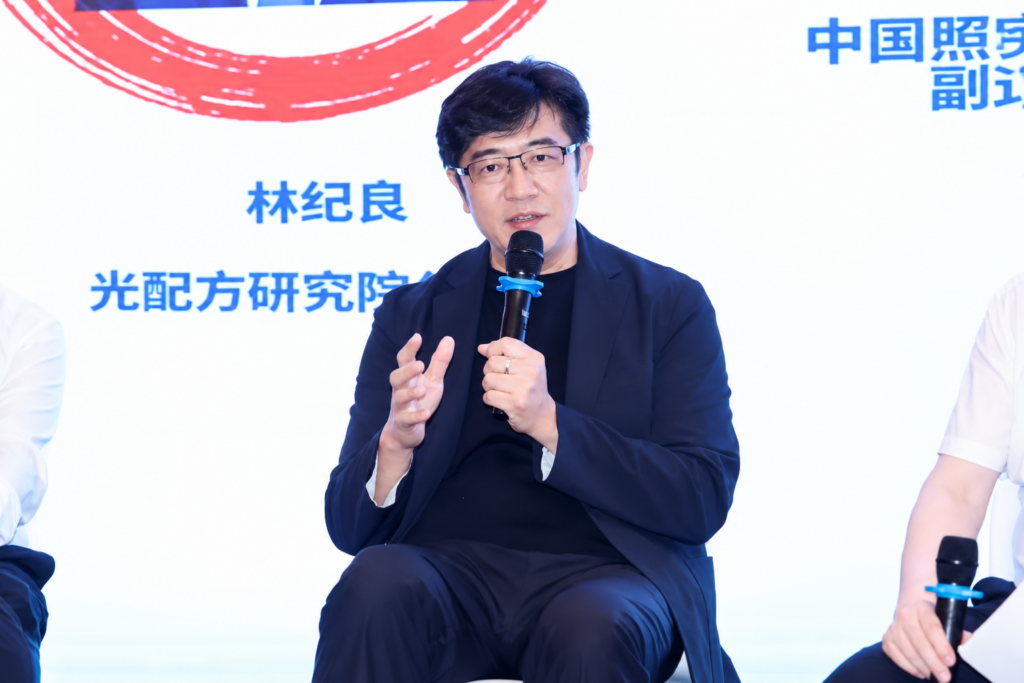
    In the afternoon, Lawrence joined a roundtable discussion on “Green Transformation and Technological Innovation Pathways for the Lighting Industry under the Dual-Carbon Goals.”

    One event, two seemingly different themes: one focused on health, the other on carbon reduction.

    But they ultimately ask the same fundamental question: What problems does the lighting industry still need to solve today—and how can we work together to break through the industry’s ceiling?


    CIE TN 016 Is Just One Point of Entry

    The morning presentation began with CIE TN 016:2026.

    This document is not a new “healthy lighting certification standard,” nor does it define what types of luminaires can be called health-oriented products. Instead, it addresses a more fundamental—and long-overlooked—question:

    When we use light to study its effects on human beings, what exactly are we recording?

    Take two light sources that both provide 500 lx at 4000 K. Their actual outcomes may still differ because of variations in spectral power distribution, eye-level direction, exposure intensity and duration, prior light exposure, and the physiological state of the participants.

    If these conditions are not fully documented, studies become difficult to compare and results difficult to reproduce. When research findings are translated into standards, products, and real-world spaces, they can easily be reduced to a few isolated parameters—and may ultimately become a situation where “everyone is speaking their own language.”

    What CIE TN 016 is really advancing, therefore, is a common language of evidence.

    But this is not the end of the journey.

    There is still a long engineering chain to connect: from laboratory data to an LED chip, from the chip to the luminaire, from the luminaire to the space, and ultimately from the space to the light reaching the human eye.

    CIE TN 016 is only a point of entry. The real question for our industry is how to create a closed loop connecting scientific research, standards, spectral design, control systems, spatial design, and on-site validation.


    Luminous Efficacy Has Improved, Yet the Industry’s Ceiling Remains

    The afternoon roundtable was moderated by Wang Xuhua, Vice Chairman of the China Lighting Electrical Appliances Association.

    The roundtable focused on the dual-carbon goals, but Lawrence raised a point during the discussion: we cannot define the dual-carbon agenda simply as continuing to increase LED chip efficacy, nor can we equate green transformation with replacing a generation of old luminaires with newer, more energy-efficient ones.

    Over the past several decades, LEDs have driven a remarkable revolution in light sources.

    From incandescent and fluorescent lamps to semiconductor lighting, we have continuously improved luminous efficacy, reduced power consumption, and extended service life. Today, the luminous efficacy of an LED can far exceed that of traditional light sources.

    But improving product efficiency does not necessarily mean improving the efficiency of a building’s lighting system.

    A highly efficient luminaire does not mean it is switched on at the right time. And integrating a smart control system does not necessarily mean that its control logic truly understands whether people are present, what they are doing, or what kind of light they actually need at that moment.

    Likewise, energy efficiency is not simply about switching off more lights or dimming them further.

    True energy efficiency means providing the right amount of light—neither insufficient nor excessive—to people engaged in specific activities, at the right place and at the right time.

    This is the shift from “luminous efficacy” to “system-level performance,” and it is the next ceiling that the lighting industry needs to break through.

    Nearly 150 Years of Artificial Electric Light: We Are Still Learning How to Use Light

    Modern artificial electric light has been with us for nearly 150 years.

    It is not that we did not understand that light is connected to people. Rather, for much of that time, we lacked the fundamental conditions and engineering capabilities needed to truly connect these relationships.

    We could not readily change spectral characteristics in real time. Sensors, digital communications, and computing platforms were either unavailable or too costly. Products, buildings, controls, and human research each spoke their own technical language. Even though we understood that natural light changes throughout the day, it was difficult to make artificial lighting dynamically respond to those changes within real buildings.

    As a result, traditional lighting developed its evaluation systems around the “lamp”:

    How many lumens?
    How many watts?
    What is the luminous efficacy?
    What is the illuminance?
    What is the color temperature?

    All of these parameters are important. But they are not enough to answer another, more fundamental question:

    What, ultimately, is the light that reaches the human being?

    Today, the conditions are changing.

    Semiconductor lighting has made spectrum, intensity, and temporal patterns increasingly controllable. Sensors allow us to perceive the environment and human activity. AIoT enables devices, spaces, and cloud platforms to connect. Digital twins and data analytics give lighting systems the potential to continuously learn and optimize.

    For the first time, we have a real opportunity to connect five dimensions:

    Light. People. Space. Time. Activity.

    These are not five independent labels.

    Where a person is, at what time, and what they are doing determines what kind of light they need. And after light passes through luminaires, building surfaces, and the surrounding space, the actual exposure that ultimately reaches the eyes determines the real visual, physiological, and behavioral experience.

    If any link is missing, “smart lighting” may become little more than connected devices; “healthy lighting” may become little more than a collection of product specifications.


    Dual-Carbon and Health Are Not Two Separate Paths

    The dual-carbon agenda asks us to reduce waste. Health asks us to become more precise.

    On the surface, one is about energy and the other about people. In reality, both point toward the same system capability:

    Delivering good light when and where it is needed.

    A good lighting environment is not necessarily one that is brighter at all times. Nor does it mean maximizing mel-EDI, color temperature, or any single spectral metric.

    During the day, people may need sufficient visual illumination together with appropriate circadian stimulation. In the evening and at night, systems should reduce unnecessary light exposure. In unoccupied areas, lighting should respond accordingly. And across different scenarios—precision work, rest, communication, or care—the light should adapt to the activity.

    When light is delivered precisely to where it is needed and at the time it is needed, health and energy efficiency no longer have to be opposing objectives.

    Health moves lighting from “Is there light?” to “Is the light appropriate?”

    The dual-carbon agenda pushes the industry from asking “How many lights have we installed?” to asking “Can we achieve better outcomes with fewer resources?”

    Together, these forces are driving lighting away from selling products and toward delivering system-level value.


    What We Truly Lack Is an Engineering Language

    Today, technology has already moved ahead. What constrains the industry is increasingly not a particular chip, material, or control protocol.

    What we need to solve is how to connect the entire chain:

    How does product data enter the design process?
    How is design intent communicated to the control system?
    How are control outcomes measured in real spaces?
    How is a person’s actual light exposure recorded?
    And how can health, comfort, energy consumption, and carbon emissions be validated through comparable methods?

    This requires an engineering language capable of connecting all stakeholders:

    From source SPD to luminaire photometry;
    from horizontal illuminance to actual eye-level exposure;
    from static parameters to temporal patterns;
    from device control to human activity;
    from design objectives to on-site validation;
    and ultimately, from one-time project delivery to continuous monitoring and optimization.

    Only when this chain of evidence is established can scientific research move beyond academic papers, standards move beyond written provisions, and smart controls move beyond demonstration projects.

    For businesses, this is also the foundation for a transformation in business models.

    In the future, lighting companies may deliver more than luminaires. They may deliver designed, commissioned, measured, and continuously optimized lighting environments.

    Competition will gradually shift away from individual product specifications toward verifiable outcomes in real spaces.


    The Ceiling Will Not Open by Itself

    At the roundtable, Lawrence called on industry leaders, researchers, designers, manufacturers, testing organizations, and control-platform providers to work together to break through the ceiling of the lighting industry.

    This is not a slogan.

    Lighting already has highly efficient light sources, intelligent controls, sensors, communication technologies, and artificial intelligence. But turning these capabilities into genuinely good light in buildings still requires us to build the standards, data, engineering, and validation systems that connect them.

    No single company can accomplish this alone. Nor should any one metric or any single standard attempt to do everything.

    We need to preserve the rigor of scientific research while understanding the realities of engineering. We must prevent health-related concepts from becoming the subject of excessive marketing, while also recognizing that imperfect evidence should not become an excuse to stop exploring and practicing.

    Modern artificial electric light has been with us for nearly 150 years.

    In the past, we focused primarily on solving the question of how to manufacture light.

    Today, we finally have the opportunity to answer a deeper question:

    How do we deliver the right light, to the right people and spaces, at the right time?

    This is the historic opportunity that semiconductor lighting and AIoT have given our generation of lighting professionals.

    Together, we should bridge the remaining gaps between research, standards, products, spaces, and validation—to break through the next ceiling of the lighting industry and bring truly healthy, comfortable, efficient, and sustainable light into the lives of billions of people.

    Perhaps this is the direction in which the “new quality productive forces” of lighting are most worth looking toward.

  • Understanding Light 09 | The 18-Part Series on Healthy Lighting / Comprehensive Lighting Basics


    Standards, Guidelines, Certifications, and Regulations: Why Can’t They Be Used Interchangeably?

    The names of these documents may look similar, but their authority, scope, and enforceability can be completely different.

    Author | Lawrence Lin

    Chairman, GLGA | Board Member, GLG | IWBI WELL Light Concept Advisor | Founder & CEO, LRS

    At project meetings, someone will often say, “CIE has already mandated that we must achieve 250.” Another person then produces a certification manual and argues, “We only need 50.” Both sides are citing documents, but they are not speaking at the same level.

    Scientific papers, technical reports, standards, recommended practices, certification systems, and national regulations each serve different purposes. Identifying what type of document you are dealing with before discussing the numbers can eliminate half the disputes.


    Six Types of Documents, Six Different Questions

    Scientific papers provide research evidence; expert consensus translates evidence within a given scope into recommendations. CIE technical reports or technical notes are used to explain measurement, the state of knowledge, and reporting methods. International or national standards define terminology, measurement methods, and technical requirements. Recommended practices provide application-oriented operational guidance. Green-building or healthy-building certification systems combine various objectives into project assessment and scoring pathways.

    The legal force of regulations and mandatory engineering codes depends on how they are adopted locally. A position statement from an international organization may be highly important, but it does not automatically become a mandatory requirement in every country. Likewise, the scoring criteria of a certification system should not be equated with a medical conclusion.


    Compare the Differences Through Three Documents

    CIE S 026 establishes an α-opic measurement system, telling us “how to measure.” The expert consensus of Brown et al. provides recommendations for specific populations, answering “what level can currently be referenced?” WELL or other certification systems specify, within their respective version frameworks, “how a project earns points.” These documents can work together, but they cannot substitute for one another.

    Similarly, CIE TN 016 is a reporting checklist for laboratory-based human studies, not an engineering design standard. A newer document number does not necessarily mean that the document covers every application scenario.


    How Should This Be Written in a Project?

    The most robust approach is to establish a “basis-of-design matrix.” For each metric, list the document’s full title, publication/version year, applicable space, applicable population, whether it is mandatory, the calculation method, and the acceptance/verification method. If a voluntary target higher than the regulatory requirement is adopted, that should also be clearly identified.

    This may appear to add one more page of documentation, but in practice it can significantly reduce disputes during bidding, change orders, and acceptance. This is particularly important when standards are updated: the team can clearly identify which requirements change with each version and which are targets independently established by the owner.


    What We Can Say Today / What We Cannot Yet Say

    What we can say today: Standards are responsible for establishing common language and methods; guidelines and recommended practices support application; certifications are used to evaluate specific projects; and regulations determine the minimum legal requirements applicable locally.

    What we cannot say: A value specified by a particular certification is equivalent to a global scientific consensus, or that a technical note automatically carries mandatory legal force.


    Three Things You Can Do Today

    • Whenever citing a metric, include the full document title, year, and clause/version.
    • In the design documentation, distinguish clearly between “statutory requirements, certification requirements, and owner targets.”
    • When numerical values conflict, first verify the measurement units, applicable population, and measurement plane.

    Evidence label: Established consensus.
    The type of document determines its purpose and boundaries; compliance does not equal a guaranteed health outcome.


    References

    • CIE S 026:2018:https://www.cie.co.at/publications/cie-system-metrology-optical-radiation-iprgc-influenced-responses-light-0
    • ISO/CIE 8995-1:2025:https://www.iso.org/standard/76342.html
    • GB/T 50034—2024 Publication Information:https://sczjjgfw.gov.cn/clas/wjhb/jsb/24/jsb202433.html
    • SLL Integrative / Circadian Lighting Position Statement:https://www.cibse.org/get-involved/societies/society-of-light-and-lighting-sll/knowledge-resources/sll-publications-and-guidance/sll-integrative-circadian-lighting-position-statement/

    In the next article, we return to the real-world setting: A desktop reading of 500 lx—why doesn’t that mean the eyes receive 500 lx?

  • China’s Listed Lighting Companies: A Three-Year Scorecard

    China’s Listed Lighting Companies: A Three-Year Scorecard
    LIGHTING RECIPE INSTITUTE
    INDUSTRY INSIGHT · 2026

    INTERNATIONAL EDITION · 2023–2026 H1

    China’s Listed Lighting Companies: A Three-Year Scorecard

    Growth is no longer the question. Value creation is.

    Black-and-white editorial view of lighting manufacturing with a red financial trend line
    Manufacturing scale is visible. Value creation requires a closer look.
    −9.9%General-lighting revenue
    2023–2025
    −7.4 ptsDrivers & controls
    gross-margin change
    +46%Automotive-lighting
    revenue growth
    ~57%Ocean’s King
    gross margin

    EXECUTIVE TAKEAWAY

    China’s lighting industry has entered a value-defence phase

    For more than a decade, Chinese lighting companies won through scale, speed and cost. Those capabilities remain formidable. What has changed is the market around them.

    The LED replacement cycle has matured, China’s property and infrastructure demand has weakened, export markets have become more fragmented, and manufacturing capacity remains abundant. Volume growth therefore no longer guarantees revenue growth, and revenue growth no longer guarantees value creation.

    This analysis reconstructs the operating performance of major listed lighting companies from 2023 through 2025, with H1 2026 used where comparable disclosure is available. It asks five questions familiar to institutional investors: Where did growth come from? Did gross margin hold? Did earnings convert into cash? Did capital earn an adequate return? And did “smart lighting” or IoT actually change the economics of the business?

    China does not lack lighting competitiveness. It has not yet converted enough of that industrial strength into pricing power, cash flow and returns on capital.

    01 · GLOBAL CONTEXT

    Lighting has become a value-defence business

    The structural challenge is global. LED adoption delivered dramatic energy savings and rapid product replacement. Its success also extended product life and reduced replacement frequency. In mature markets, lighting is no longer naturally a high-growth category.

    Signify’s medium-term framework illustrates the shift: limited comparable sales growth, but stronger adjusted EBITA margin and free-cash-flow conversion. Acuity offers another reference point. Its Acuity Brands Lighting business saw revenue decline modestly from fiscal 2023 to 2025, while operating margin improved from 13.7% to 16.4%.

    SIGNIFYLow growth, tighter portfolio

    Margin, cash generation and capital discipline take priority over volume.

    ACUITYLess revenue, more operating margin

    Portfolio mix, pricing and channel efficiency protect mature-market returns.

    CHINADeepest supply chain, fiercest price pressure

    Industrial strength is not automatically pricing power.

    China faces the same market maturity, but with a distinctive industrial structure: the world’s deepest and fastest lighting supply chain, alongside a large pool of overlapping manufacturing capacity. When demand slows, this strength can become a source of severe price pressure.

    02 · METHOD

    Listed does not automatically mean comparable

    The universe is filtered twice: first by the economic substance of the business, then by whether segment disclosure is continuous enough to support comparison.

    Figure 1. Selection logic for the core balanced sample.
    Included

    Luminaires, lamps, lighting electricals, LED drivers, dimming and controls, plus directly lighting-linked IoT devices.

    Excluded

    LED packages, epitaxy, chips, raw materials and generic electronics without identifiable lighting use.

    Bridged, not mixed

    Mixed segments—such as MLS, Leedarson IoT and Goneo Group’s smart electrical and lighting business—are shown separately rather than forced into a pure-lighting ranking.

    Important: consolidated net profit is never divided by one segment’s revenue and presented as a “lighting net margin” unless segment profit is explicitly disclosed.

    03 · SECTOR SCORECARD

    Growth and margin moved in different directions

    Figure 2. Core balanced samples. Revenue indexed to 2023=100; gross margins are revenue-weighted.
    Core sample2023 revenue2025 revenueChangeGM 2023GM 2025
    General lightingRMB 30.68bnRMB 27.63bn−9.9%36.5%34.8%
    Drivers & controlsRMB 4.67bnRMB 4.65bnBroadly flat30.3%22.9%
    Professional lightingRMB 2.25bnRMB 2.13bn−5.5%53.3%51.4%
    Automotive lightingRMB 12.02bnRMB 17.56bn+46.2%23.3%21.3%
    Lighting engineeringRMB 1.19bnRMB 0.92bn−22.7%32.0%26.4%

    The central pattern is divergence. Automotive lighting delivered the strongest growth, but at a lower margin. Professional lighting retained the highest gross margin, but must still pass the cash-conversion test. Drivers and controls kept revenue broadly stable while losing 7.4 percentage points of margin—the clearest warning that stable sales can conceal deteriorating economics.

    04 · GENERAL LIGHTING & EXPORT ODM

    OPPLE defends scale; growth elsewhere often comes at a price

    Figure 3. OPPLE and YANKON gross margins are H1 2026; PAK and SNC are FY2025. Directional comparison, not a same-date ranking.
    BRAND + CHANNEL

    OPPLE

    Revenue ~−10%

    Domestic retail and residential channels cushion the downturn, but have not yet restored counter-cyclical pricing power.

    EXPORT MANUFACTURING

    YANKON

    Revenue −13.4%

    Scale and engineering remain strong; standardised products and OEM exposure limit cost pass-through.

    COMMERCIAL / PROJECT

    PAK

    Revenue below −20%

    Project exposure and fixed channel costs create the weakest operating leverage of the three established brands.

    EXPORT ODM

    SNC

    Revenue +4.8%

    Growth was preserved while gross margin fell from roughly 25% to 19%—more scale, lower value density.

    If sales growth is the sole metric, SNC appears stronger than OPPLE. If the test is pricing power and value density, OPPLE’s business quality remains higher. For ODM manufacturers, the next decisive indicator is not whether revenue continues to grow, but whether margin stops falling.

    05 · DRIVERS & CONTROLS

    Control intelligence commands a premium. Standardised power does not.

    The balanced drivers-and-controls sample generated roughly the same revenue in 2025 as in 2023, yet weighted gross margin fell from 30.3% to 22.9%. Price concessions preserved shipments while economic value eroded.

    LTECH 2025~49%gross margin

    LTECH’s scale is modest, but its value density is high. Protocol capability, intelligent power supplies, dimming expertise and system integration make its products harder to replace than standard drivers. Inventronics, MOSO and similar suppliers can sustain volume through scale, but remain more exposed to material costs, customer concentration and annual price reductions.

    The strategic dividing line is no longer whether a company sells “smart lighting.” It is whether the company owns protocols, system entry points and recurring customer relationships.

    06 · PROFESSIONAL LIGHTING

    High gross margin must still pass the cash test

    Ocean’s King~57%2023–2025 gross margin
    H1 2026>58%gross margin

    Certification, reliability, specialised environments, direct service and long customer relationships clearly support premium economics. Ocean’s King’s margin is roughly 23 points above OPPLE’s H1 2026 lighting margin and almost 40 points above SNC’s FY2025 margin.

    Yet gross margin is not the final answer. Professional-lighting companies can carry high sales and service costs, while controls specialists must continue funding R&D and protocol compatibility. Margin stability, sales-expense discipline, receivables and operating cash flow are the decisive tests.

    07 · AUTOMOTIVE LIGHTING

    The strongest growth, but not the safest margin

    RMB 12.02bn2023RMB 17.56bn2025+46%

    The Xingyu–Keboda balanced sample significantly outgrew every other lighting segment. Weighted gross margin nevertheless declined from 23.3% to 21.3%.

    Xingyu Automotive Lighting

    Programme development, OEM qualification and large-scale production create meaningful barriers. But project wins require front-loaded R&D and capacity, while automakers continue to demand annual price reductions.

    KEBODA

    Lighting-control products sit closer to automotive electronics and software. Technical stickiness is higher, but customer concentration, programme timing and cycle risk remain.

    08 · LIGHTING ENGINEERING

    The business model under the greatest pressure

    −22.7%Revenue
    2023–2025
    −5.6 ptsGross-margin
    change
    Cash firstContract assets and receivables matter more than bookings

    HES Technology suffered severe revenue contraction and continuing losses; MINKAVE faced restructuring and going-concern issues; Luoman retained project capability but remained highly exposed to project timing and non-core capital allocation.

    For engineering companies, reported revenue is a poor standalone indicator. The essential questions are whether revenue produces cash, whether contract assets are rising, whether receivables are ageing, and whether final settlement preserves the booked project margin.

    09 · MLS / LEDVANCE

    One group, two very different economic models

    Figure 4. The MLS mixed line includes MLS/Forest Lighting, OEM manufacturing and some upstream activities. H1 2026 revenue is not directly comparable with full-year figures.

    In 2025, LEDVANCE generated approximately RMB 9.25 billion of revenue at about 40% gross margin. The MLS mixed product line generated roughly RMB 7.63 billion at about 10.2%. The revenue pools are similar; their margins differ by almost 30 percentage points.

    The contrast demonstrates the value of global brand, distribution and market access. It also shows why MLS cannot be evaluated through a single lighting number. H1 2026 cash recovery was meaningful, but still requires separation of working-capital effects, impairment comparisons, consolidation changes and non-recurring items.

    10 · LEEDARSON

    A lighting ODM core with adjacent IoT capabilities

    Figure 5. IoT includes sensing and security products; it is not all direct lighting revenue.

    Leedarson should not be presented primarily as a controls or software-platform company. Its economic foundation remains lighting ODM: scale manufacturing, engineering, cost management, delivery and global customer relationships.

    Lighting plus IoT generated approximately RMB 6.04 billion in 2025 at a weighted gross margin near 26.3%. From 2023 to 2025, combined revenue was broadly flat while margin declined by about five points. “Having IoT products” is not the same as “capturing IoT economics.” The proof must come through margin, customer lock-in, recurring software or service income and capital returns.

    11 · GONEO GROUP / BULL

    Not a pure lighting company—but a valuable strategic benchmark

    2025 smart electrical & lighting segmentRMB 8.1bn46.3% gross margin

    The segment also includes wall switches and sockets, circuit breakers, bathroom appliances, clothes-drying systems, smart locks and curtain motors. It cannot be counted as pure lighting revenue.

    Its strategic relevance is different. Goneo Group, through the BULL brand, places lighting within a broader home-electrical entry point and monetises brand, distribution and consumer trust. Most manufacturers cannot copy this model directly, but they can learn from the logic: own more of the spatial or household relationship rather than selling an isolated luminaire.

    Figure 6. The widest scope is a contaminated upper bound, not a pure-lighting market size.

    12 · THE REAL SCORECARD

    Five tests for value creation

    1. Is growth organic and economically valuable?

      Separate unit growth, price, mix, acquisitions and accounting-scope effects. Growth matters only when incremental revenue improves margin and cash.

    2. Does gross margin demonstrate pricing power?

      Rising revenue with falling gross margin often means that scale is being purchased through price concessions.

    3. Do earnings become cash?

      Operating cash flow, free cash flow, receivables and inventory are often more revealing than reported net income.

    4. Does invested capital earn an adequate return?

      New capacity and acquired goodwill should be tested against utilisation, incremental gross profit and returns above the cost of capital.

    5. Has “transformation” changed the business model?

      IoT, AI and smart lighting are not outcomes. The evidence is higher willingness to pay, recurring revenue, customer lock-in and improved capital returns.

    Figure 7. Five dimensions: trend, margin, cash, visibility and disclosure. Maximum 25; excludes valuation and is not an investment rating.

    13 · H1 2026 & OUTLOOK

    Selective repair, not a comprehensive turnaround

    Several listed lighting companies reported better revenue or profit in H1 2026. Part of the improvement reflects low bases, consolidation changes, currency movements or lower one-off expenses. Some companies also disclosed less product-level revenue and cost information than in their annual reports, reducing comparability.

    A genuine recovery requires three conditions to appear together:

    01Price stabilisationRevenue growth stops materially lagging volume growth.
    02Margin confirmationMajor segment margins stabilise or improve for at least two reporting periods.
    03Cash disciplineCash flow improves without accelerating receivables or inventory.

    What should Chinese lighting companies do next?

    • Exit scale that does not earn its cost of capital.
    • Move from product specifications to measurable spatial performance.
    • Make controls and data a capability, not an accessory.
    • Reframe globalisation around brands, channels and disciplined integration.
    • Use cash flow to constrain acquisitions and capacity expansion.
    • Improve product-line and segment disclosure.

    CONCLUSION

    Lighting will endure. The old growth logic will not.

    Buildings, cities, vehicles, healthcare, agriculture, culture and intelligent spaces will continue to need better light. What is becoming obsolete is the assumption that LED replacement, capacity expansion and lower prices will automatically produce growth.

    The next winners may not have the highest output. They will have a clearer value proposition, stronger pricing power, more reliable cash conversion and a credible ability to connect light with controls, space, health, energy and service.

    China has already proved that it can make lighting cheaper, more efficient and more widely available. The next test is whether it can make light more valuable.

    Sources & methodology

    Company figures are drawn from public annual and interim reports and announcements. Segment and consolidated figures are kept separate. Undisclosed data are not filled with zeroes or unsupported estimates. Approximate figures reflect differences in company disclosure and reporting periods. This article is industry and operating analysis, not investment advice.

    1. MLS Co., Ltd., 2024 and 2025 annual reports and H1 2026 interim report.
    2. Leedarson IoT Technology Inc., annual and interim reports.
    3. GONEO GROUP CO., LTD., public segment disclosures.
    4. Acuity Inc., fiscal 2025 results and fiscal 2026 quarterly disclosures.
    5. Signify, 2025 results and 2026 Capital Markets Day materials.
    6. Guangya Lighting Research Institute, H1 2026 industry-chain review.
    7. Public filings of OPPLE, YANKON, PAK, SNC, LTECH, Ocean’s King, Xingyu, KEBODA, Inventronics, MOSO, HES Technology, MINKAVE and Luoman.
    © 2026 Lighting Recipe InstituteResearch and commentary by Lawrence Lin

    Postscript — 8 September 2026

    I thank Simon Häger for his careful reading and specific questions about the figures and comparisons in this article. His comments highlighted several distinctions that deserve clearer treatment. The following clarifications qualify the relevant statements in the article.

    Sample coverage

    The professional-lighting discussion draws on selected listed companies. Ocean’s King provides a case study of a particular business model; its margins cannot represent the wider Chinese professional-lighting sector.

    Similarly, the approximately 46% automotive-lighting revenue increase refers to the combined selected businesses of Xingyu and Keboda between 2023 and 2025. It should be read as growth within that two-company sample, rather than an estimate of total sector growth. The same distinction between sample results and market-wide performance applies to the other category aggregates.

    Reporting periods and comparisons

    H1 2026 and FY2025 margins cover different periods and may reflect seasonality, product mix and other changes. Their presentation together does not establish a comparable ranking. Any suggestion that these figures alone demonstrate one company’s superior performance, including the SNC–OPPLE comparison, should therefore be disregarded.

    Acuity: the segment basis is consistent

    The 13.7% figure for FY2023 and 16.4% for FY2025 both refer to reported ABL segment operating margins. They do not combine a consolidated margin with a segment margin, and neither is an adjusted operating margin. However, consistent reporting scope does not establish what caused the improvement; charges and other period-specific factors also require consideration.

    Sources: Acuity FY2023 Form 10-K and Acuity FY2025 results.

    LEDVANCE: the reporting scope matters

    MLS’s 2025 annual report discloses revenue of RMB9.250 billion, cost of revenue of RMB5.552 billion and a gross margin of 39.98% for its LEDVANCE product category. This supports the rounded figure of approximately 40% used in the article.

    The figure refers specifically to the category disclosed by MLS. It should not be interpreted as a replacement-lamp-only margin, a standalone LEDVANCE GmbH operating margin or a net profit margin. It also does not, by itself, establish the return achieved on the acquisition.

    Source: MLS 2025 annual report, revenue and cost analysis by product.

    Margins and analytical boundaries

    OPPLE can have a relatively high gross margin while experiencing margin pressure. These statements are compatible, but gross-margin movements alone cannot establish changes in pricing power. Costs, product mix, exchange rates and accounting classifications may also affect the result. Likewise, falling revenue and gross margin alone do not prove that both sales volumes and selling prices declined.

    The study seeks to exclude non-lighting activities wherever disclosures permit. Some mixed categories, including broader IoT and electrical-product businesses, cannot be fully separated. These figures should be treated as broader business references, not pure-lighting totals or directly comparable measures of business quality.

    I take responsibility for these distinctions and for the conclusions drawn from the data. I welcome further scrutiny of the original disclosures and calculations, and will record any additional verified corrections in a dated note. My thanks again to Simon for helping make the analysis more precise.


  • Understanding Light 08 | The 18-Part Series on Healthy Lighting / Comprehensive Lighting Basics

    250, 10, 1: Scientific Consensus, or a Universal Pass/Fail Threshold?

    How to use the three recommended values correctly: start with the population, time of day, and measurement conditions

    Author | Lawrence Lin

    Chairman, GLGA | Board Member, GLG | IWBI WELL Light Concept Advisor | Founder & CEO, LRS


    250 during the day, 10 at night, 1 while sleeping.

    These three numbers have spread rapidly in the healthy lighting community—and are also among the easiest to distort in the process of communication. Some people put them on lighting product packaging; others treat them as mandatory thresholds for every type of building.

    These recommendations come from expert consensus and provide an important reference point: during the day, the eye should receive a relatively high level of mel-EDI; exposure should be significantly reduced during the three hours before bedtime; and the sleep environment should be kept as close to darkness as practical. However, the recommendations have clearly defined target populations and measurement conditions. They are not product certification thresholds that can be applied independently of context.


    What Do the Three Numbers Actually Mean?

    For healthy adults aged 18 to 55 with regular daytime schedules, experts recommend that, during the day, mel-EDI at eye level should ideally reach at least 250 lx, measured on a vertical plane at approximately 1.2 meters.

    During the three hours before bedtime, mel-EDI at eye level should ideally be kept at no more than 10 lx.

    During sleep, mel-EDI should ideally be kept at no more than 1 lx.

    If a person must get up and move around at night, then, provided safety requirements are met, exposure is recommended to remain at no more than 10 lx mel-EDI, while exposure duration should be minimized.

    Note that “at least” and “no more than” point in opposite directions. It is not enough to simply remember the numbers.


    The Recommendations Cannot Be Applied Directly to Every Project

    Older adults, children, night-shift workers, hospital patients, and people with sleep disorders may require more specific professional judgment.

    Likewise, an office should not create glare simply to achieve 250 lx mel-EDI. In a hospital, nighttime lighting should never compromise patient-care or staff safety simply to reduce a numerical value.

    In addition, these recommendations concern light exposure received by people, not factory-set product specifications.

    If a product claims to “achieve 250 mel-EDI” without specifying the distance, direction, spatial reflectance, and dimming/control conditions, the claim has no complete engineering meaning.


    Why Do You Still See 50?

    Some building certifications or older provisions use EML, or specify different thresholds for particular spaces and times of day.

    EML and mel-EDI are not the same quantity and should not be used interchangeably. Certification requirements may also vary by edition, compliance pathway, and applicable exemptions.

    A project should first confirm which edition of which standard or certification framework applies, and then perform the corresponding calculation. Do not combine 50, 250, 10, and 1 into a single “global standard table.”


    What We Can Say Today—and What We Cannot

    What we can say:

    250 / 10 / 1 are light-exposure recommendations for a specific population—healthy adults with regular daily schedules—based on the current body of evidence. They can serve as an important reference for lighting design.

    What we cannot say:

    Meeting these values does not guarantee a health outcome, and failing to meet them does not automatically mean that the lighting is harmful.

    Nor should these values be treated as mandatory requirements applicable to all populations, buildings, or regulations.


    Three Things You Can Do Today

    • When citing these numbers, always specify the target population, time period, eye-level position, and vertical measurement direction.
    • First protect visual comfort, safety, and task requirements, then optimize mel-EDI through daylight, light distribution, and lighting controls.
    • For certified projects, verify the formal definition of each metric in the applicable edition. Do not convert or mix metrics on your own.

    Evidence label: Use with caution.
    The recommendations have a basis in expert consensus; project outcomes still need to be evaluated in the context of the specific environment and population.


    References

    • Brown et al., 2022:https://journals.plos.org/plosbiology/article?id=10.1371/journal.pbio.3001571
    • CIE PS 001:2024:https://cie.co.at/publications/cie-position-statement-integrative-lighting-recommending-proper-light-proper-time-3rd
    • ANSI/IES RP-46-25:https://store.ies.org/product/recommended-practice-supporting-the-physiological-and-behavioral-effects-of-lighting-in-interior-daytime-environments/
    • WELL Circadian Lighting Design (verify the applicable edition when using this reference):https://standard.wellcertified.com/light/circadian-lighting-design

    In the next article, we will unpack another common source of confusion: standards, guidelines, certifications, and regulations—what does each one actually govern?