At project meetings, someone will often say, “CIE has already mandated that we must achieve 250.” Another person then produces a certification manual and argues, “We only need 50.” Both sides are citing documents, but they are not speaking at the same level.
Scientific papers, technical reports, standards, recommended practices, certification systems, and national regulations each serve different purposes. Identifying what type of document you are dealing with before discussing the numbers can eliminate half the disputes.
Six Types of Documents, Six Different Questions
Scientific papers provide research evidence; expert consensus translates evidence within a given scope into recommendations. CIE technical reports or technical notes are used to explain measurement, the state of knowledge, and reporting methods. International or national standards define terminology, measurement methods, and technical requirements. Recommended practices provide application-oriented operational guidance. Green-building or healthy-building certification systems combine various objectives into project assessment and scoring pathways.
The legal force of regulations and mandatory engineering codes depends on how they are adopted locally. A position statement from an international organization may be highly important, but it does not automatically become a mandatory requirement in every country. Likewise, the scoring criteria of a certification system should not be equated with a medical conclusion.
Compare the Differences Through Three Documents
CIE S 026 establishes an α-opic measurement system, telling us “how to measure.” The expert consensus of Brown et al. provides recommendations for specific populations, answering “what level can currently be referenced?” WELL or other certification systems specify, within their respective version frameworks, “how a project earns points.” These documents can work together, but they cannot substitute for one another.
Similarly, CIE TN 016 is a reporting checklist for laboratory-based human studies, not an engineering design standard. A newer document number does not necessarily mean that the document covers every application scenario.
How Should This Be Written in a Project?
The most robust approach is to establish a “basis-of-design matrix.” For each metric, list the document’s full title, publication/version year, applicable space, applicable population, whether it is mandatory, the calculation method, and the acceptance/verification method. If a voluntary target higher than the regulatory requirement is adopted, that should also be clearly identified.
This may appear to add one more page of documentation, but in practice it can significantly reduce disputes during bidding, change orders, and acceptance. This is particularly important when standards are updated: the team can clearly identify which requirements change with each version and which are targets independently established by the owner.
What We Can Say Today / What We Cannot Yet Say
What we can say today: Standards are responsible for establishing common language and methods; guidelines and recommended practices support application; certifications are used to evaluate specific projects; and regulations determine the minimum legal requirements applicable locally.
What we cannot say: A value specified by a particular certification is equivalent to a global scientific consensus, or that a technical note automatically carries mandatory legal force.
Three Things You Can Do Today
Whenever citing a metric, include the full document title, year, and clause/version.
In the design documentation, distinguish clearly between “statutory requirements, certification requirements, and owner targets.”
When numerical values conflict, first verify the measurement units, applicable population, and measurement plane.
Evidence label: Established consensus. The type of document determines its purpose and boundaries; compliance does not equal a guaranteed health outcome.
References
CIE S 026:2018:https://www.cie.co.at/publications/cie-system-metrology-optical-radiation-iprgc-influenced-responses-light-0
China’s Listed Lighting Companies: A Three-Year Scorecard
Growth is no longer the question. Value creation is.
Lawrence LinFounder, Lighting Recipe InstituteChair, Good Light Group Asia (GLGA)Former Global CEO, LEDVANCE
Manufacturing scale is visible. Value creation requires a closer look.
−9.9%General-lighting revenue 2023–2025
−7.4 ptsDrivers & controls gross-margin change
+46%Automotive-lighting revenue growth
~57%Ocean’s King gross margin
EXECUTIVE TAKEAWAY
China’s lighting industry has entered a value-defence phase
For more than a decade, Chinese lighting companies won through scale, speed and cost. Those capabilities remain formidable. What has changed is the market around them.
The LED replacement cycle has matured, China’s property and infrastructure demand has weakened, export markets have become more fragmented, and manufacturing capacity remains abundant. Volume growth therefore no longer guarantees revenue growth, and revenue growth no longer guarantees value creation.
This analysis reconstructs the operating performance of major listed lighting companies from 2023 through 2025, with H1 2026 used where comparable disclosure is available. It asks five questions familiar to institutional investors: Where did growth come from? Did gross margin hold? Did earnings convert into cash? Did capital earn an adequate return? And did “smart lighting” or IoT actually change the economics of the business?
China does not lack lighting competitiveness. It has not yet converted enough of that industrial strength into pricing power, cash flow and returns on capital.
01 · GLOBAL CONTEXT
Lighting has become a value-defence business
The structural challenge is global. LED adoption delivered dramatic energy savings and rapid product replacement. Its success also extended product life and reduced replacement frequency. In mature markets, lighting is no longer naturally a high-growth category.
Signify’s medium-term framework illustrates the shift: limited comparable sales growth, but stronger adjusted EBITA margin and free-cash-flow conversion. Acuity offers another reference point. Its Acuity Brands Lighting business saw revenue decline modestly from fiscal 2023 to 2025, while operating margin improved from 13.7% to 16.4%.
SIGNIFYLow growth, tighter portfolio
Margin, cash generation and capital discipline take priority over volume.
ACUITYLess revenue, more operating margin
Portfolio mix, pricing and channel efficiency protect mature-market returns.
Industrial strength is not automatically pricing power.
China faces the same market maturity, but with a distinctive industrial structure: the world’s deepest and fastest lighting supply chain, alongside a large pool of overlapping manufacturing capacity. When demand slows, this strength can become a source of severe price pressure.
02 · METHOD
Listed does not automatically mean comparable
The universe is filtered twice: first by the economic substance of the business, then by whether segment disclosure is continuous enough to support comparison.
Figure 1. Selection logic for the core balanced sample.
Included
Luminaires, lamps, lighting electricals, LED drivers, dimming and controls, plus directly lighting-linked IoT devices.
Excluded
LED packages, epitaxy, chips, raw materials and generic electronics without identifiable lighting use.
Bridged, not mixed
Mixed segments—such as MLS, Leedarson IoT and Goneo Group’s smart electrical and lighting business—are shown separately rather than forced into a pure-lighting ranking.
Important: consolidated net profit is never divided by one segment’s revenue and presented as a “lighting net margin” unless segment profit is explicitly disclosed.
03 · SECTOR SCORECARD
Growth and margin moved in different directions
Figure 2. Core balanced samples. Revenue indexed to 2023=100; gross margins are revenue-weighted.
Core sample
2023 revenue
2025 revenue
Change
GM 2023
GM 2025
General lighting
RMB 30.68bn
RMB 27.63bn
−9.9%
36.5%
34.8%
Drivers & controls
RMB 4.67bn
RMB 4.65bn
Broadly flat
30.3%
22.9%
Professional lighting
RMB 2.25bn
RMB 2.13bn
−5.5%
53.3%
51.4%
Automotive lighting
RMB 12.02bn
RMB 17.56bn
+46.2%
23.3%
21.3%
Lighting engineering
RMB 1.19bn
RMB 0.92bn
−22.7%
32.0%
26.4%
The central pattern is divergence. Automotive lighting delivered the strongest growth, but at a lower margin. Professional lighting retained the highest gross margin, but must still pass the cash-conversion test. Drivers and controls kept revenue broadly stable while losing 7.4 percentage points of margin—the clearest warning that stable sales can conceal deteriorating economics.
04 · GENERAL LIGHTING & EXPORT ODM
OPPLE defends scale; growth elsewhere often comes at a price
Figure 3. OPPLE and YANKON gross margins are H1 2026; PAK and SNC are FY2025. Directional comparison, not a same-date ranking.
BRAND + CHANNEL
OPPLE
Revenue ~−10%
Domestic retail and residential channels cushion the downturn, but have not yet restored counter-cyclical pricing power.
EXPORT MANUFACTURING
YANKON
Revenue −13.4%
Scale and engineering remain strong; standardised products and OEM exposure limit cost pass-through.
COMMERCIAL / PROJECT
PAK
Revenue below −20%
Project exposure and fixed channel costs create the weakest operating leverage of the three established brands.
EXPORT ODM
SNC
Revenue +4.8%
Growth was preserved while gross margin fell from roughly 25% to 19%—more scale, lower value density.
If sales growth is the sole metric, SNC appears stronger than OPPLE. If the test is pricing power and value density, OPPLE’s business quality remains higher. For ODM manufacturers, the next decisive indicator is not whether revenue continues to grow, but whether margin stops falling.
05 · DRIVERS & CONTROLS
Control intelligence commands a premium. Standardised power does not.
The balanced drivers-and-controls sample generated roughly the same revenue in 2025 as in 2023, yet weighted gross margin fell from 30.3% to 22.9%. Price concessions preserved shipments while economic value eroded.
LTECH 2025~49%gross margin
LTECH’s scale is modest, but its value density is high. Protocol capability, intelligent power supplies, dimming expertise and system integration make its products harder to replace than standard drivers. Inventronics, MOSO and similar suppliers can sustain volume through scale, but remain more exposed to material costs, customer concentration and annual price reductions.
The strategic dividing line is no longer whether a company sells “smart lighting.” It is whether the company owns protocols, system entry points and recurring customer relationships.
06 · PROFESSIONAL LIGHTING
High gross margin must still pass the cash test
Ocean’s King~57%2023–2025 gross margin
H1 2026>58%gross margin
Certification, reliability, specialised environments, direct service and long customer relationships clearly support premium economics. Ocean’s King’s margin is roughly 23 points above OPPLE’s H1 2026 lighting margin and almost 40 points above SNC’s FY2025 margin.
Yet gross margin is not the final answer. Professional-lighting companies can carry high sales and service costs, while controls specialists must continue funding R&D and protocol compatibility. Margin stability, sales-expense discipline, receivables and operating cash flow are the decisive tests.
07 · AUTOMOTIVE LIGHTING
The strongest growth, but not the safest margin
RMB 12.02bn2023→RMB 17.56bn2025+46%
The Xingyu–Keboda balanced sample significantly outgrew every other lighting segment. Weighted gross margin nevertheless declined from 23.3% to 21.3%.
Xingyu Automotive Lighting
Programme development, OEM qualification and large-scale production create meaningful barriers. But project wins require front-loaded R&D and capacity, while automakers continue to demand annual price reductions.
KEBODA
Lighting-control products sit closer to automotive electronics and software. Technical stickiness is higher, but customer concentration, programme timing and cycle risk remain.
08 · LIGHTING ENGINEERING
The business model under the greatest pressure
−22.7%Revenue 2023–2025
−5.6 ptsGross-margin change
Cash firstContract assets and receivables matter more than bookings
HES Technology suffered severe revenue contraction and continuing losses; MINKAVE faced restructuring and going-concern issues; Luoman retained project capability but remained highly exposed to project timing and non-core capital allocation.
For engineering companies, reported revenue is a poor standalone indicator. The essential questions are whether revenue produces cash, whether contract assets are rising, whether receivables are ageing, and whether final settlement preserves the booked project margin.
09 · MLS / LEDVANCE
One group, two very different economic models
Figure 4. The MLS mixed line includes MLS/Forest Lighting, OEM manufacturing and some upstream activities. H1 2026 revenue is not directly comparable with full-year figures.
In 2025, LEDVANCE generated approximately RMB 9.25 billion of revenue at about 40% gross margin. The MLS mixed product line generated roughly RMB 7.63 billion at about 10.2%. The revenue pools are similar; their margins differ by almost 30 percentage points.
The contrast demonstrates the value of global brand, distribution and market access. It also shows why MLS cannot be evaluated through a single lighting number. H1 2026 cash recovery was meaningful, but still requires separation of working-capital effects, impairment comparisons, consolidation changes and non-recurring items.
10 · LEEDARSON
A lighting ODM core with adjacent IoT capabilities
Figure 5. IoT includes sensing and security products; it is not all direct lighting revenue.
Leedarson should not be presented primarily as a controls or software-platform company. Its economic foundation remains lighting ODM: scale manufacturing, engineering, cost management, delivery and global customer relationships.
Lighting plus IoT generated approximately RMB 6.04 billion in 2025 at a weighted gross margin near 26.3%. From 2023 to 2025, combined revenue was broadly flat while margin declined by about five points. “Having IoT products” is not the same as “capturing IoT economics.” The proof must come through margin, customer lock-in, recurring software or service income and capital returns.
11 · GONEO GROUP / BULL
Not a pure lighting company—but a valuable strategic benchmark
The segment also includes wall switches and sockets, circuit breakers, bathroom appliances, clothes-drying systems, smart locks and curtain motors. It cannot be counted as pure lighting revenue.
Its strategic relevance is different. Goneo Group, through the BULL brand, places lighting within a broader home-electrical entry point and monetises brand, distribution and consumer trust. Most manufacturers cannot copy this model directly, but they can learn from the logic: own more of the spatial or household relationship rather than selling an isolated luminaire.
Figure 6. The widest scope is a contaminated upper bound, not a pure-lighting market size.
12 · THE REAL SCORECARD
Five tests for value creation
Is growth organic and economically valuable?
Separate unit growth, price, mix, acquisitions and accounting-scope effects. Growth matters only when incremental revenue improves margin and cash.
Does gross margin demonstrate pricing power?
Rising revenue with falling gross margin often means that scale is being purchased through price concessions.
Do earnings become cash?
Operating cash flow, free cash flow, receivables and inventory are often more revealing than reported net income.
Does invested capital earn an adequate return?
New capacity and acquired goodwill should be tested against utilisation, incremental gross profit and returns above the cost of capital.
Has “transformation” changed the business model?
IoT, AI and smart lighting are not outcomes. The evidence is higher willingness to pay, recurring revenue, customer lock-in and improved capital returns.
Figure 7. Five dimensions: trend, margin, cash, visibility and disclosure. Maximum 25; excludes valuation and is not an investment rating.
13 · H1 2026 & OUTLOOK
Selective repair, not a comprehensive turnaround
Several listed lighting companies reported better revenue or profit in H1 2026. Part of the improvement reflects low bases, consolidation changes, currency movements or lower one-off expenses. Some companies also disclosed less product-level revenue and cost information than in their annual reports, reducing comparability.
A genuine recovery requires three conditions to appear together:
02Margin confirmationMajor segment margins stabilise or improve for at least two reporting periods.
03Cash disciplineCash flow improves without accelerating receivables or inventory.
What should Chinese lighting companies do next?
Exit scale that does not earn its cost of capital.
Move from product specifications to measurable spatial performance.
Make controls and data a capability, not an accessory.
Reframe globalisation around brands, channels and disciplined integration.
Use cash flow to constrain acquisitions and capacity expansion.
Improve product-line and segment disclosure.
CONCLUSION
Lighting will endure. The old growth logic will not.
Buildings, cities, vehicles, healthcare, agriculture, culture and intelligent spaces will continue to need better light. What is becoming obsolete is the assumption that LED replacement, capacity expansion and lower prices will automatically produce growth.
The next winners may not have the highest output. They will have a clearer value proposition, stronger pricing power, more reliable cash conversion and a credible ability to connect light with controls, space, health, energy and service.
China has already proved that it can make lighting cheaper, more efficient and more widely available. The next test is whether it can make light more valuable.
Sources & methodology
Company figures are drawn from public annual and interim reports and announcements. Segment and consolidated figures are kept separate. Undisclosed data are not filled with zeroes or unsupported estimates. Approximate figures reflect differences in company disclosure and reporting periods. This article is industry and operating analysis, not investment advice.
MLS Co., Ltd., 2024 and 2025 annual reports and H1 2026 interim report.
Leedarson IoT Technology Inc., annual and interim reports.
GONEO GROUP CO., LTD., public segment disclosures.
Acuity Inc., fiscal 2025 results and fiscal 2026 quarterly disclosures.
Signify, 2025 results and 2026 Capital Markets Day materials.
Guangya Lighting Research Institute, H1 2026 industry-chain review.
Public filings of OPPLE, YANKON, PAK, SNC, LTECH, Ocean’s King, Xingyu, KEBODA, Inventronics, MOSO, HES Technology, MINKAVE and Luoman.
Postscript — 8 September 2026
I thank Simon Häger for his careful reading and specific questions about the figures and comparisons in this article. His comments highlighted several distinctions that deserve clearer treatment. The following clarifications qualify the relevant statements in the article.
Sample coverage
The professional-lighting discussion draws on selected listed companies. Ocean’s King provides a case study of a particular business model; its margins cannot represent the wider Chinese professional-lighting sector.
Similarly, the approximately 46% automotive-lighting revenue increase refers to the combined selected businesses of Xingyu and Keboda between 2023 and 2025. It should be read as growth within that two-company sample, rather than an estimate of total sector growth. The same distinction between sample results and market-wide performance applies to the other category aggregates.
Reporting periods and comparisons
H1 2026 and FY2025 margins cover different periods and may reflect seasonality, product mix and other changes. Their presentation together does not establish a comparable ranking. Any suggestion that these figures alone demonstrate one company’s superior performance, including the SNC–OPPLE comparison, should therefore be disregarded.
Acuity: the segment basis is consistent
The 13.7% figure for FY2023 and 16.4% for FY2025 both refer to reported ABL segment operating margins. They do not combine a consolidated margin with a segment margin, and neither is an adjusted operating margin. However, consistent reporting scope does not establish what caused the improvement; charges and other period-specific factors also require consideration.
Sources: Acuity FY2023 Form 10-K and Acuity FY2025 results.
LEDVANCE: the reporting scope matters
MLS’s 2025 annual report discloses revenue of RMB9.250 billion, cost of revenue of RMB5.552 billion and a gross margin of 39.98% for its LEDVANCE product category. This supports the rounded figure of approximately 40% used in the article.
The figure refers specifically to the category disclosed by MLS. It should not be interpreted as a replacement-lamp-only margin, a standalone LEDVANCE GmbH operating margin or a net profit margin. It also does not, by itself, establish the return achieved on the acquisition.
Source: MLS 2025 annual report, revenue and cost analysis by product.
Margins and analytical boundaries
OPPLE can have a relatively high gross margin while experiencing margin pressure. These statements are compatible, but gross-margin movements alone cannot establish changes in pricing power. Costs, product mix, exchange rates and accounting classifications may also affect the result. Likewise, falling revenue and gross margin alone do not prove that both sales volumes and selling prices declined.
The study seeks to exclude non-lighting activities wherever disclosures permit. Some mixed categories, including broader IoT and electrical-product businesses, cannot be fully separated. These figures should be treated as broader business references, not pure-lighting totals or directly comparable measures of business quality.
I take responsibility for these distinctions and for the conclusions drawn from the data. I welcome further scrutiny of the original disclosures and calculations, and will record any additional verified corrections in a dated note. My thanks again to Simon for helping make the analysis more precise.
“250 during the day, 10 at night, 1 while sleeping.”
These three numbers have spread rapidly in the healthy lighting community—and are also among the easiest to distort in the process of communication. Some people put them on lighting product packaging; others treat them as mandatory thresholds for every type of building.
These recommendations come from expert consensus and provide an important reference point: during the day, the eye should receive a relatively high level of mel-EDI; exposure should be significantly reduced during the three hours before bedtime; and the sleep environment should be kept as close to darkness as practical. However, the recommendations have clearly defined target populations and measurement conditions. They are not product certification thresholds that can be applied independently of context.
What Do the Three Numbers Actually Mean?
For healthy adults aged 18 to 55 with regular daytime schedules, experts recommend that, during the day, mel-EDI at eye level should ideally reach at least 250 lx, measured on a vertical plane at approximately 1.2 meters.
During the three hours before bedtime, mel-EDI at eye level should ideally be kept at no more than 10 lx.
During sleep, mel-EDI should ideally be kept at no more than 1 lx.
If a person must get up and move around at night, then, provided safety requirements are met, exposure is recommended to remain at no more than 10 lx mel-EDI, while exposure duration should be minimized.
Note that “at least” and “no more than” point in opposite directions. It is not enough to simply remember the numbers.
The Recommendations Cannot Be Applied Directly to Every Project
Older adults, children, night-shift workers, hospital patients, and people with sleep disorders may require more specific professional judgment.
Likewise, an office should not create glare simply to achieve 250 lx mel-EDI. In a hospital, nighttime lighting should never compromise patient-care or staff safety simply to reduce a numerical value.
In addition, these recommendations concern light exposure received by people, not factory-set product specifications.
If a product claims to “achieve 250 mel-EDI” without specifying the distance, direction, spatial reflectance, and dimming/control conditions, the claim has no complete engineering meaning.
Why Do You Still See 50?
Some building certifications or older provisions use EML, or specify different thresholds for particular spaces and times of day.
EML and mel-EDI are not the same quantity and should not be used interchangeably. Certification requirements may also vary by edition, compliance pathway, and applicable exemptions.
A project should first confirm which edition of which standard or certification framework applies, and then perform the corresponding calculation. Do not combine 50, 250, 10, and 1 into a single “global standard table.”
What We Can Say Today—and What We Cannot
What we can say:
250 / 10 / 1 are light-exposure recommendations for a specific population—healthy adults with regular daily schedules—based on the current body of evidence. They can serve as an important reference for lighting design.
What we cannot say:
Meeting these values does not guarantee a health outcome, and failing to meet them does not automatically mean that the lighting is harmful.
Nor should these values be treated as mandatory requirements applicable to all populations, buildings, or regulations.
Three Things You Can Do Today
When citing these numbers, always specify the target population, time period, eye-level position, and vertical measurement direction.
First protect visual comfort, safety, and task requirements, then optimize mel-EDI through daylight, light distribution, and lighting controls.
For certified projects, verify the formal definition of each metric in the applicable edition. Do not convert or mix metrics on your own.
Evidence label: Use with caution. The recommendations have a basis in expert consensus; project outcomes still need to be evaluated in the context of the specific environment and population.
References
Brown et al., 2022:https://journals.plos.org/plosbiology/article?id=10.1371/journal.pbio.3001571
WELL Circadian Lighting Design (verify the applicable edition when using this reference):https://standard.wellcertified.com/light/circadian-lighting-design
In the next article, we will unpack another common source of confusion: standards, guidelines, certifications, and regulations—what does each one actually govern?
Someone showed me a product brochure that stated, “mel-EDI = 0.85.” I asked for the measurement unit and illuminance conditions, but they could not answer immediately. The problem is a typical one: a ratio and an equivalent illuminance value had been conflated.
mel-EDI and mel-DER are related, but they are not the same quantity. The former answers how much melanopic-related stimulus a person receives at a specific location, and its unit is lx. The latter answers how efficient a given light spectrum is, relative to standard daylight, at producing melanopic stimulation per unit of visual illuminance; it is a dimensionless ratio.
mel-EDI: Converting Stimulation into “Equivalent Daylight Illuminance”
The full name of mel-EDI is melanopic equivalent daylight illuminance. It converts measured melanopic-related irradiance into the amount of visual illuminance from standard D65 daylight that would produce an equivalent stimulus.
Therefore, mel-EDI must always be associated with a location, direction, time, and operating condition. If someone says, “This space has 250 lx mel-EDI,” they should also specify whether this was measured at eye height, on a vertical plane, facing which direction, and during what time period.
mel-DER: The Relative Efficiency of a Light Spectrum
The full name of mel-DER is melanopic daylight efficacy ratio. It describes the relative ability of a particular spectrum to produce melanopic stimulation per unit of visual illuminance. The mel-DER of D65 is defined as 1.
Under the same geometric conditions, a useful approximation is:
mel-EDI ≈ visual illuminance × mel-DER
For example, if the vertical illuminance at eye position is 300 lx and the spectrum has a mel-DER of 0.75, then the mel-EDI is approximately 225 lx. If the illuminance is dimmed to half while the spectrum remains unchanged, the mel-DER will still be approximately 0.75, while the mel-EDI will decrease accordingly.
Why You Shouldn’t Simply Chase a Higher mel-DER
A high mel-DER can help achieve greater melanopic stimulation during the daytime with less visual illuminance. However, lighting design still needs to address color rendering, glare, visual comfort, energy consumption, and nighttime control. At night, if a system cannot be dimmed sufficiently, a high mel-DER may instead increase stimulation that is not needed.
Therefore, spectral efficiency is not simply a matter of “higher is better.” It needs to be matched to the time of day and the application scenario. Truly useful product documentation should provide the spectrum, mel-DER, and achievable spatial mel-EDI under multiple dimming levels or CCT settings.
What We Can Say Today / What We Still Cannot Say
What we can say:
mel-EDI is a spatial exposure quantity with units; mel-DER is a dimensionless spectral efficiency ratio. Both should be calculated in accordance with CIE S 026.
What we still cannot say:
You cannot determine whether a project meets its target simply by looking at a luminaire’s mel-DER. Nor should mel-EDI be expressed as a percentage or as a unitless index.
Three Things You Can Do Today
Check that all documentation uses the terms mel-EDI and mel-DER consistently.
For every mel-EDI value, specify the measurement point, direction, time period, and lighting scenario.
When procuring lighting products, request the spectral data files rather than accepting only a single cosmetically enhanced spectral curve.
Evidence label: Established consensus. CIE S 026 provides a standardized metrology framework; the measured quantities themselves do not predict specific health outcomes.
References
CIE S 026:2018:https://www.cie.co.at/publications/cie-system-metrology-optical-radiation-iprgc-influenced-responses-light-0
CIE α-opic tools and technical notes:https://cie.co.at/publications/technical-notes
In the next article, we can finally discuss 250, 10, and 1: Are they useful recommendations, or have they been misused as universal pass/fail thresholds?
Two useful metrics, but they cannot answer every question
Author | Lawrence Lin
Chairman, GLGA | Board Member, GLG | IWBI WELL Light Concept Advisor | LRS Founder & CEO
During a design review, a lighting consultant said, “The workplane has 500 lx and a CCT of 4000 K, so it already meets the health requirements.”
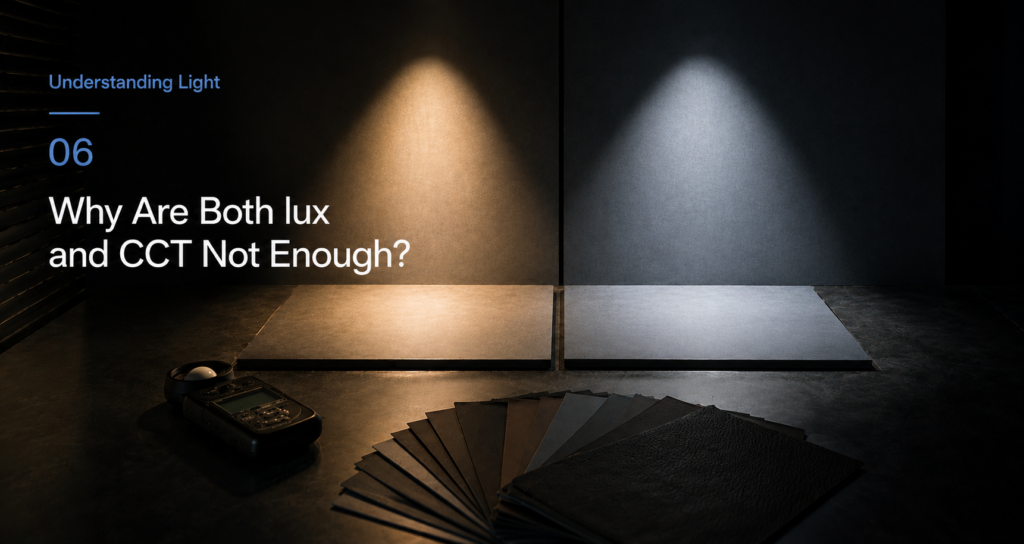
This statement sounds complete, but it actually answers only part of the question: approximately how much visual illuminance is present on the workplane, and whether the overall appearance of the light is relatively cool or warm.
Lux and correlated color temperature (CCT) are both important, but they are not a universal language for human light exposure. When discussing integrated lighting, we also need to consider spectrum, direction, time, and metrics suitable for non-visual pathways.
What Does Lux Measure?
Illuminance is weighted according to the human photopic spectral sensitivity function V(λ), making it suitable for describing the amount of light needed for visual tasks. It has long been used for workplane illuminance, roadway lighting, and indoor lighting standards, and remains an indispensable fundamental metric in lighting engineering.
The issue is that the melanopsin-related pathway has a different spectral sensitivity from V(λ). Two light sources with the same visual illuminance can therefore produce different levels of melanopic stimulation.
So lux is not wrong—it is simply answering a different question.
What Does CCT Measure?
Correlated color temperature describes how closely the color appearance of a light source resembles that of a blackbody radiator at a given temperature. It helps us communicate whether light appears warm white or cool white, but it does not describe the complete spectrum.
Different LED formulations can have the same CCT while producing different color-rendering characteristics, melanopic proportions, and blue-light hazard-weighted results.
Treating CCT as a measure of “health dose” is like judging the nutritional value of food based solely on its color. It provides some information, but not enough.
The Most Intuitive Comparison
Imagine two spaces, A and B. Both have 500 lx on the workplane and both are specified as 4000 K.
In Space A, most of the light comes from side windows and a large luminous ceiling, making the visual field in the direction of the person’s gaze relatively bright.
In Space B, narrow-beam downlights are used. The workplane is bright, but the walls in front of the person are relatively dark.
The visual task may be completed equally well in both spaces, but the amount of light reaching the eyes from the direction of gaze could be very different.
Looking further at the spectrum, the two systems could also have different mel-DER values. Only by measuring or calculating the spectral irradiance at the eye position can we properly characterize these differences.
What We Can Say Today / What We Cannot
What we can say: Lux is appropriate for visual illuminance, while CCT is appropriate for describing color appearance. When discussing ipRGC-related stimulation, α-opic metrics defined by CIE S 026 should be used.
What we cannot say: 500 lx or 4000 K, by themselves, are sufficient conditions for health, alertness, or improved sleep.
Three Things You Can Do Today
Keep illuminance and CCT, but supplement them with spectral information and melanopic metrics measured at the eye position and in the direction of gaze.
When comparing products, make sure the measurements were obtained under the same dimming level, temperature, distance, and geometric conditions.
In design presentations, clearly state whether each metric is addressing a visual, color-appearance, or circadian-related question.
Evidence label: Established consensus. Different metrics serve different purposes and cannot substitute for one another.
References
CIE S 026:2018 — https://www.cie.co.at/publications/cie-system-metrology-optical-radiation-iprgc-influenced-responses-light-0
I’ve read quite a few press releases claiming that “a certain type of light improves performance.” The headlines are clear, but the methods section often says little more than “participants were exposed to cool-white light.” There is no spectrum, no illuminance at the eye, no exposure duration, and sometimes not even an indication of where the light came from. Even when the conclusions are compelling, such studies are difficult for engineers to reproduce.
CIE TN 016:2026 provides a checklist of light characteristics that should be reported in laboratory-based human studies. Its value lies in making research more transparent, comparable, and reproducible. But it is important to be clear: it is not a building design standard, nor is it a field inspection or acceptance specification.
Why “Cool-White Light” Is Far From Enough
Two light sources with the same color temperature can have different spectra. The amount of light received by the eyes can also vary depending on the distance and direction of the same luminaire. If a study reports only CCT or illuminance at the desktop, it cannot answer the fundamental question of what the participant’s retina actually received.
At a minimum, an interpretable light intervention should report the light source and spectrum, measurement quantities, measurement location and direction, spatial distribution, exposure start and end times, exposure duration, dimming state, and controls on light exposure before the experiment. For human studies, it should also describe participant age, sleep-wake schedule, pupil conditions, and the comparison group.
A Checklist Is Not a Quality Certification
Providing a complete report of an intervention does not mean that the intervention itself is effective. It simply gives others the information needed to evaluate its effectiveness.
Conversely, missing information does not necessarily prove that a conclusion is wrong, but it does significantly weaken its verifiability.
The engineering community can borrow this way of thinking. If a design report simply says “circadian lighting was used,” it is equally difficult to review. At a minimum, it should specify the target population, time period, measurement points, measurement direction, target metrics, calculation conditions, and control scenario.
Research and engineering are not the same thing, but fully describing the conditions is a common baseline requirement.
How to Read a Study Quickly
Start with the people: healthy adults, children, older adults, or patients?
Then look at the light: was it measured at the eyes or on the desktop? Was the measurement illuminance or an α-opic quantity?
Next, look at time: What time did the exposure begin? How long did it last? What lighting environment were participants in beforehand?
Finally, look at the outcomes: hormones, subjective scales, cognitive tasks, or long-term clinical outcomes?
If you cannot answer all four questions, don’t rush to turn the title of a paper into a product slogan.
What We Can Say Now / What We Still Cannot Say
What we can say: CIE TN 016 can be used to check the completeness of reporting in laboratory-based human light studies, and to support comparison and reproducibility.
What we still cannot say: Following this checklist does not mean that a study or lighting system has received a “healthy lighting certification,” nor can the checklist be directly used to inspect or approve a building project.
Three Things You Can Do Today
When reading a study, check whether information about people, light, time, and outcomes is complete.
When publishing human-subject trial results, companies should provide verifiable spectral data and measurement conditions.
Engineering reports can adopt the spirit of the checklist, while developing a separate measurement and acceptance protocol appropriate for field conditions.
Evidence label: Established consensus. Transparent reporting is fundamental to research credibility; a reporting framework is not the same thing as an application standard.
CIE S 026:2018: https://www.cie.co.at/publications/cie-system-metrology-optical-radiation-iprgc-influenced-responses-light-0
Next, we turn to measurement: why are the familiar metrics of lux and CCT still insufficient to describe all the light information received by the human body?
In senior-living projects, I have seen situations like this: all illuminance levels on the design drawings meet the requirements, and younger commissioning staff find the space bright enough, while older residents still say, “I can’t see clearly.” Elsewhere, one person feels alert by the window in the afternoon, while another remains tired because of insufficient sleep the night before.
Lighting can be standardized, but human responses can only be predicted within a certain range. Acknowledging these differences does not mean giving up on design; quite the opposite—it allows design to move from averages toward real users.
1 | Age Changes the Light That Reaches the Eyes
As people age, lens transmittance, pupil size, and visual adaptation all change. Older adults typically need more light to perform the same visual tasks and may receive less short-wavelength stimulation relevant to circadian regulation. At the same time, excessive brightness and poor glare control can cause greater discomfort.
Therefore, senior-living spaces should not simply double the overall illuminance. A more effective approach is to improve contrast, light distribution, surface reflectance, glare control, and daytime light exposure in the direction of the eyes simultaneously.
2 | Light History Changes Current Responses
The human body does not start from zero every day. How much daylight a person has received, whether the previous few hours were spent in bright or dim environments, and whether their recent sleep-wake schedule has been regular can all influence subsequent responses. Night-shift workers, people traveling across time zones, and regular daytime workers should not necessarily follow the same unadjusted schedule.
This also explains why rigorously controlled laboratory findings need to be revalidated in real buildings. People move around, pull curtains, turn their heads, work overtime, and adjust lighting themselves. Behavior itself is part of light exposure.
3 | “Human-Centric” Is Not Just a Slogan
A meaningful definition of the target population should include, at minimum, age range, primary sleep-wake schedule, activity type, time spent in the space, typical viewing directions, and specific visual needs. Schools should distinguish between children and teachers; hospitals should distinguish between patients, care staff, and night-shift doctors; residential environments should distinguish between getting up during the night, reading, and relaxing before bed.
If a project brief simply says “create a healthy and comfortable environment” without specifying who is doing what and when, the objective is almost impossible to calculate or verify.
3 | What We Can Say / What We Cannot Yet Say
What we can say: Age, pupil size, ocular media, sleep-wake patterns, previous light exposure, and behavior all contribute to differences between individuals and populations.
What we cannot yet say: That reaching a single threshold will produce the same effect for people of all ages, work schedules, and health conditions.
4 | Three Things That Can Be Done Today
Establish a “user profile” at project kickoff, including at least age, sleep-wake patterns, and periods of occupancy.
In spaces for older adults, prioritize visibility, contrast, and glare control before addressing circadian targets.
For shift workers and special medical populations, involve sleep or medical professionals rather than simply copying recommendations designed for ordinary offices.
Evidence label: Existing consensus. Human responses vary significantly; quantitative prescriptions for specific populations require more specific evidence.
References
CIE S 026:2018: https://www.cie.co.at/publications/cie-system-metrology-optical-radiation-iprgc-influenced-responses-light-0
Brown et al., 2022: https://journals.plos.org/plosbiology/article?id=10.1371/journal.pbio.3001571
Next time, we will look at the issue from another perspective: If a human study wants others to believe its findings, how precisely does it need to describe the “light” involved?
Is a Single Light Bulb Really “Ruining Your Health”?
New Scientist August 2026 Cover: A Proposition Worth Taking Seriously—and Testing Against the Evidence
Lawrence Lin | Founder & CEO, Lighting Recipe Studio (LRS) | Founder & Chairman, Good Light Group Asia (GLGA)
Core Judgment: This is not an article to shrug off—and certainly not one to use as a tool for selling lights. The scientific question it raises is worth taking seriously; the causal answer it offers is still far from mature.
Over the past few days, a black-background cover has circulated rapidly across the international lighting and light-health communities on LinkedIn. Beside a hanging light bulb, it asks: “Why this light bulb is wrecking your health.” The article goes further, connecting modern LEDs, insulated glazing, the lack of red and near-infrared light, mitochondrial function, and a chain of purported causal links to diabetes, dementia, cancer, and cardiovascular disease.
This is not a story from a fringe publication. Its author, Graham Lawton, holds a degree in biochemistry from Imperial College London and a master’s degree in science communication. He has worked at New Scientist for many years and received the UK PPA’s Writer of the Year award in 2023. Precisely because of this, the cover has sparked more than simple sharing—it has triggered a serious, highly technical, and at times sharply contested debate over the evidence.
01 | The Real LinkedIn Debate Isn’t About Whether “Red Light Works”
As of the time of writing, a discussion post by German chronobiologist Manuel Spitschan had around 74 comments, while a post by renowned lighting designer Rogier van der Heide had around 70. Participants span chronobiology, vision science, lighting design, architecture and engineering, healthy buildings, and photobiomodulation. For a lighting cover story, this is more than ordinary social-media engagement—it has become a public, cross-disciplinary peer review.
Manuel Spitschan: There Is a Long Evidence Chain Between “Biologically Plausible” and “Harm to Populations”
Spitschan is Professor of Chronobiology and Health at the Technical University of Munich and also leads a research group at the Max Planck Institute. He acknowledges that red and near-infrared light can influence biological processes involving mitochondria, and that photobiomodulation is a legitimate field of research. But he points out that mechanistic experiments, small-scale interventions, associations with daylight exposure, and hypotheses about indoor light spectra represent different levels of evidence. They cannot simply be stitched together to conclude that “LEDs cause metabolic disease.”
His key reminder: Biological plausibility does not equal population-level harm. Correlation does not establish mechanism. And the effectiveness of a particular intervention does not mean that the absence of that intervention constitutes a “nutritional deficiency.”
Rogier van der Heide: Fear Is Not a Lighting Strategy
Rogier has more than 35 years of experience in lighting design. He has led global design teams at companies including Philips and Zumtobel and has received the IALD Radiance Award. His criticism focuses on the way the cover compresses a complex issue: the article discusses LEDs, glazing, daylight, infrared radiation, daily schedules, and architecture as an interconnected system, yet the cover reduces it to a single household light bulb—and, in doing so, creates a health scare.
He supports brighter days, gentler evenings, and better access to daylight. But he rejects slogans such as “ultra-processed light” or “95% of the spectrum is lost” when they are not clearly defined and are used in place of actual design strategies.
Kevin Houser: The Industry Has Even Gotten Part of Lighting History Wrong
Houser is a professor of lighting and human factors at Oregon State University and serves as a principal engineer at the Pacific Northwest National Laboratory. He adds an important industry perspective: many buildings transitioned from fluorescent lighting to LEDs, rather than directly from incandescent lighting to LEDs. Fluorescent lamps also do not produce the same rich infrared output associated with incandescent sources.
At the same time, temporal light modulation—often discussed as flicker—introduced by LED drivers may be a more immediate and measurable issue. A sensational “light bulb scare” headline can therefore distract from the health, comfort, and performance questions the industry actually needs to address.
Martin Moore-Ede: Don’t Let Dislike of the Headline Obscure the Potential Risks of Spectral Transition
There is also another side worth hearing. Martin Moore-Ede, head of the Circadian Light Research Center and a former professor at Harvard Medical School, argues that the cover has at least succeeded in drawing public attention to narrow-spectrum blue-pumped LEDs. He emphasizes that the issue is not only the absence of near-infrared light, but also the failure to remove inappropriate short-wavelength light at night.
It is worth noting that his post also promotes his own new book and his “healthy light diet” proposition. That does not automatically invalidate his views, but readers are entitled to understand the broader communication and commercial context surrounding them.
The emerging consensus on LinkedIn, therefore, is not that “LEDs are safe” or that “LEDs are harmful.”
A more accurate consensus is this:
Light is biologically active. Modern indoor light environments deserve renewed scrutiny. But any health claim must specify the spectrum, intensity, timing, duration, direction, site of exposure, and cumulative dose.
Campfires, candles, and incandescent lamps all contain relatively abundant long-wavelength components. But “contains” does not automatically mean “the dose is sufficient” or “the light has a clinically demonstrated effect.”
Image source: provided by the user / original article illustration.
02 | The Article Reveals Three Distinct “Light–Health” Pathways That Are Being Conflated
First: Light Enters Through the Eyes and Acts on the Circadian System
This is currently the relatively mature pathway. Sufficient daytime light exposure to the eyes helps synchronize the circadian system, while light at inappropriate times at night can affect sleep and circadian rhythms.
Relevant metrics include vertical illuminance at the eye, spectral power distribution, melanopic EDI, timing, and duration of exposure. This pathway is fundamentally different from asking how much near-infrared radiation is absorbed by the skin.
Second: Red / Near-Infrared Light Acts Directly on Tissue
This falls under the pathway of photobiomodulation (PBM). Research in this area typically uses specific wavelengths and clearly defined irradiance and energy doses to expose the skin or targeted tissue.
The appropriate measurement language is nm, mW/cm², J/cm², exposure area, and target location—not lux or CCT.
Applying results from therapeutic-dose experiments directly to ordinary indoor lighting is one of the article’s biggest logical leaps.
Third: The Overall Effects of Daylight and Outdoor Environments
Daylight simultaneously changes illuminance, spectrum, temporal dynamics, field of view, physical activity, air quality, temperature, and behavior.
If a daylight group performs better than an artificial-light group, that does not automatically prove that near-infrared light is the sole cause. These studies are highly valuable, but more refined experimental controls are needed to progressively separate the individual factors.
LRS Perspective: A “healthy lighting” question is not yet a verifiable engineering proposition unless we can first answer: Where does the light enter the human body? At what dose? At what time? And what biological target is it acting on?
03 | Put the Key Evidence Back Where It Belongs
The studies cited in the article are not without evidence. But the strength of that evidence is far from sufficient to support the kind of causal conclusions implied by the cover.
670 nm and blood glucose | 30 healthy participants received a 15-minute red-light intervention at approximately 36 J/cm². The incremental area under the postprandial two-hour blood glucose curve decreased by 27.7%, while the peak decreased by 7.5%. This was a clearly dosed, acute photobiomodulation (PBM) experiment—not a study of ordinary indoor lighting.
Daylight and type 2 diabetes | 13 people with type 2 diabetes participated in a randomized crossover study comparing 4.5 days of daylight with 4.5 days of artificial light. One measure within a narrower blood-glucose range improved, but major outcomes such as mean interstitial glucose were not uniformly significant. More importantly, daylight represents an entire exposure environment and cannot be attributed to near-infrared light alone.
Supplementing LEDs with broader-spectrum light and vision | A 2026 Scientific Reports study suggested that supplementing a conventional LED environment with broader-spectrum light may improve color-contrast performance. But the sample was very small, and the findings primarily concern visual performance. They cannot be extrapolated to risks of diabetes, cancer, or dementia.
The overall clinical evidence for PBM | A 2025 umbrella review included 15 meta-analyses, 204 randomized trials, and more than 9,000 participants. Some indications showed positive signals, but the overall evidence was generally low to moderate quality, with substantial heterogeneity in treatment parameters.
What Can We Establish?
Most white-light LEDs produce little to no near-infrared output. That is a measurable spectral fact. Red and near-infrared light can produce biological effects at specific doses, and this is supported by genuine research evidence.
What Can’t We Establish Yet?
“Red-light deficiency” is not yet a recognized medical condition. There is no evidence establishing that the replacement of conventional lighting with LEDs is an important cause of diabetes, dementia, cancer, or cardiovascular disease. Nor is there a generally accepted healthy indoor near-infrared dose threshold.
Plant lighting has already become accustomed to discussing wavelengths beyond the visible spectrum. For human lighting to enter the same level of discussion, the first requirement is more rigorous definitions of exposure and more precise dose measurement.
Image source: provided by the user / original article illustration.
04 | Why China’s Lighting Industry and Academic Community Must Pay Attention
China has the world’s largest LED manufacturing base, supply chain, and application market. If long-wavelength light does prove to have meaningful long-term health value, the implications could be enormous. But if the evidence remains insufficient and is nevertheless packaged as “full-spectrum healthy lighting” or “NIR wellness lamps,” the potential for consumer misinformation—and subsequent industry backlash—could be equally significant.
Over the past two decades, we have optimized LEDs to be more efficient, more affordable, longer-lasting, and easier to control. None of these achievements is a mistake. But the industry’s evaluation framework still revolves primarily around luminous efficacy, illuminance, CCT, color rendering, glare, and cost.
Even as we move into “healthy lighting,” many projects still stop at melanopic EDI or a single “circadian mode” button.
The debate over near-infrared light now reminds us of something important:
We may not yet be measuring “light” completely.
Traditional visual and circadian metrics primarily address the visible spectrum and ocular exposure.
Tissue effects from red and near-infrared light require consideration of irradiance, energy dose, geometry, body location, and time-integrated exposure.
“Full spectrum” cannot be defined simply by visual continuity, high CRI, or a color temperature close to daylight.
Glazing, shading, interior materials, distance, and direction can all change the actual broad-spectrum exposure reaching the human body.
05 | What LRS and GLGA Are Building Is Not Another Slogan, but a New Evidence Infrastructure for Light
From traditional lighting and the transformation of the LED industry to the founding of LRS, I have watched the industry repeatedly compress complex questions into a single selling point.
But lasting intellectual credibility is rarely built by being the first to announce a conclusion. It is built by being the first to establish a common language, reliable measurement methods, and robust validation processes.
01 | Establish a “Two-Layer Light Exposure” Framework
Record ocular/circadian exposure separately from skin/tissue broad-spectrum exposure.
The former can use metrics such as melanopic EDI; the latter should extend to spectral irradiance and cumulative energy dose in the red and near-infrared ranges.
02 | Advance Broad-Spectrum Measurement Research Across 380–1700 nm
The next step for LRS should be to extend its existing capabilities in visible-light measurement, color quality, temporal light modulation, and HCL into a research-grade workflow covering the visible spectrum, IR-A, and portions of IR-B.
The goal is not to “prove” a product’s efficacy.
The first goal is to establish what light is actually present in the environment—and how much the human body may actually receive.
03 | Design Controlled Experiments Where Visible Light Is Equivalent but Near-Infrared Exposure Differs
Keep illuminance, CCT, color rendering, melanopic EDI, and temporal light modulation as consistent as possible while varying only the near-infrared dose.
Then separately examine visual, metabolic, sleep, and subjective comfort outcomes.
This is the kind of experimental design that could begin to identify the independent contribution of NIR.
04 | Build a Database Based on Real-World Chinese Environments
Offices, schools, hospitals, senior-care facilities, homes, industrial spaces, and transportation hubs should all be measured across the full day, with broad-spectrum measurements taken at multiple occupant positions—rather than measuring a single workplane illuminance value only at project acceptance.
05 | GLGA to Build a Cross-Disciplinary Community
Bring together researchers and practitioners from photobiology, chronobiology, endocrinology and metabolic medicine, ophthalmology, optical metrology, building science, lighting design, controls, and standards organizations to jointly establish research agendas, terminology, reporting templates, and conflict-of-interest disclosure rules.
The next step for healthy buildings is not to add another “healthy lighting” label to a luminaire.
It is to connect daylight, spectrum, time, space, and operational verification into one integrated system.
Image source: King’s College Hospital NHS Foundation Trust / provided by the user.
06 | Conclusion: The More Invisible the Light, the More Visible the Evidence Needs to Be
I do not believe we have enough evidence today to declare that “LEDs are destroying our health.” Nor do I believe the industry should retreat to the old defensive position that says, “As long as a product meets lighting standards, it has nothing to do with health” simply because a headline is exaggerated.
What this cover truly exposes is the knowledge boundary of the lighting industry.
We have become highly proficient at measuring the light that the human eye sees. Yet we are still not very good at describing the totality of light that the human body actually receives over the course of a day.
We are beginning to talk about health outcomes, but we still lack a shared language for dose, timing, pathways, and validation.
The worst thing the Chinese lighting industry could do is quickly manufacture another wave of “red-light mythology.”
The most valuable thing we could do is leverage our extensive supply chain, diverse application environments, and strong research capabilities to turn this question into a reproducible, comparable, and verifiable research program.
Call to Action
GLGA is open to working with Chinese and international organizations across photobiology, chronobiology, medicine, metrology, design, manufacturing, and standards to develop a research agenda for “indoor broad-spectrum light exposure and health.”
LRS is prepared to contribute the foundational work in measurement, data collection, and real-world validation.
We are not in a hurry to prove how miraculous red light might be.
First, let’s measure the light we cannot see.
What we should perhaps be most concerned about is not any particular light bulb.
It is that while the scientific boundaries remain unclear, we continue to use familiar metrics and pretend that we have already measured the whole of light.
Author Bio
Lawrence Lin is the Founder & CEO of Lighting Recipe Studio (LRS), Founder & Chairman of Good Light Group Asia (GLGA), Board Member of Good Light Group, and a WELL Light Concept Advisor for IWBI. He previously served as Global CEO of LEDVANCE.
His work focuses on translating research on light and health into lighting practices that are measurable, designable, deliverable, and verifiable.
Disclosure
LRS develops measurement tools for spectrum, color quality, temporal light modulation, and healthy lighting. As a result, LRS has a clear professional and commercial interest in the question of expanding the boundaries of light-environment measurement.
This article does not constitute medical advice, nor does it endorse the health benefits of any specific light source or near-infrared product.
The LinkedIn comments referenced in this article are translated excerpts or summaries of publicly available posts. Engagement figures are dynamic and may change over time.
Key References & Public Discussions
New Scientist original article (Graham Lawton, August 10, 2026): https://www.newscientist.com/article/2582914-the-shock-revelation-that-light-bulbs-are-wrecking-your-metabolism/
Public archive of the original article: https://archive.ph/lvNDq
Manuel Spitschan’s LinkedIn discussion: https://www.linkedin.com/posts/spitschan_there-is-an-interesting-scientific-question-activity-7495302203025379328-oqzn
Rogier van der Heide’s LinkedIn discussion: https://www.linkedin.com/posts/rogiervanderheide_new-scientist-i-think-we-need-to-talk-activity-7495395143349633024-2pel
Martin Moore-Ede’s LinkedIn discussion: https://www.linkedin.com/posts/martin-moore-ede-80630a12_the-recent-new-scientist-magazine-cover-story-activity-7496213907687030787-EEmH
Powner & Jeffery: 670 nm and blood glucose (Journal of Biophotonics, 2024): https://doi.org/10.1002/jbio.202300521
Harmsen et al.: Natural daylight and type 2 diabetes (Cell Metabolism, 2026): https://doi.org/10.1016/j.cmet.2025.11.006
Melatonin Is Not the Whole Story: How Does Light Affect Alertness, Sleep, and Our Biological Clock?
Don’t Mistake One Hormone for the Entire Spectrum of Human Responses
Author | Lawrence Lin
Chairman, GLGA | Board Member, GLG | IWBI WELL Light Concept Advisor | LRS Founder & CEO
In discussions about healthy lighting, melatonin is often pushed to center stage. Some products use “percentage of melatonin suppression” to demonstrate alertness, while others use “less blue light” to demonstrate better sleep. But the human response to light extends far beyond a single hormonal curve.
Light can advance or delay the circadian clock, but it can also affect moment-to-moment alertness, subjective sleepiness, pupil responses, and sleep readiness. Melatonin is an important measure, but it is not the only one—and certainly not a universal health scorecard for everyone.
Three Effects: Don’t Conflate Them
The first is circadian phase. Light in the morning and at night can push the internal clock in different directions. The effect depends on when the light occurs, not simply on its intensity.
The second is the acute response. Stronger light at night may suppress melatonin and may also make people feel more alert in the moment. An acute change does not automatically translate into a long-term health benefit or harm.
The third is sleep and behavioral outcomes. Bedtime, sleep duration, daytime activity, caffeine intake, screen use, and social schedules all play a role. Lighting is an important variable, but it is not the only one.
Therefore, when a study shows “melatonin decreased,” we cannot directly translate that into “sleep will necessarily be worse.” Likewise, when people report “feeling more alert,” we cannot automatically conclude that “work performance will necessarily improve.”
Why Timing Matters More Than Color Temperature
The same light can have very different physiological effects depending on whether it appears in the morning, evening, or late at night. During the day, we need a sufficiently bright environment; before bedtime, we need to significantly reduce the amount of stimulation reaching the eyes. A single, fixed “healthy color temperature” throughout the day is often less effective than a well-defined timing strategy.
In the home, this difference is easy to see. If the living room remains as bright at night as it is during the day, it may still be too bright even if the color temperature is somewhat warmer. Conversely, if the home is lit only with dim, warm light during the day, it may fail to provide a sufficiently strong daytime signal. It is generally more prudent to address “when and how much” first, and optimize the spectrum afterward.
Why Do Research Findings So Often Differ?
What happens before a light exposure matters greatly. Someone who has spent the day outdoors may respond differently to the same light at night than someone who has spent the entire day in a dimly lit room. If a study does not report participants’ prior light exposure, exposure duration, measurement location, pupil response, or daily schedule, its findings can be difficult to compare with those of other studies.
This is what scientific caution is about: not denying that light affects people, but refusing to compress complex responses into a one-size-fits-all marketing claim.
What We Can Say Now / What We Still Can’t Say
What we can say: The amount, spectrum, timing, duration of light exposure, and prior light history can collectively influence circadian rhythms and acute responses.
What we still can’t say: A single measurement of melatonin, by itself, can prove that a particular lighting system will improve long-term sleep, mood, cognition, or disease risk.
Three Things You Can Do Today
Design lighting strategies around daytime, pre-bedtime, and sleep periods, rather than simply dividing lighting into cool and warm color temperatures.
When reviewing human-subject research, check whether it measures hormonal responses, subjective experience, cognitive performance, or actual sleep outcomes.
When conducting post-occupancy or project follow-ups, include daily schedules, daytime outdoor light exposure, and screen use in the records.
Evidence status: Established consensus / Can be applied with caution.
Light can affect human circadian rhythms and acute responses. However, caution is still warranted when extrapolating from short-term biomarkers to long-term health outcomes.
References
Brown et al., 2022, PLOS Biology:https://journals.plos.org/plosbiology/article?id=10.1371/journal.pbio.3001571
Understanding Rods, Cones, and ipRGCs: Why Light Affects the Whole Body
Author | Lawrence Lin
Chairman, GLGA | Board Member, GLG | IWBI WELL Light Concept Advisor | LRS Founder & CEO
An architect once asked me, “If light affects the biological clock, why not simply measure how bright it is?” That question gets to the heart of the matter. We tend to think of the eye as a camera, but overlook the fact that it is also the body’s gateway for sensing the day–night cycle.
Rods and cones help us form visual perception. Meanwhile, intrinsically photosensitive retinal ganglion cells (ipRGCs), which contain the photopigment melanopsin, transmit information about environmental light to brain regions involved in circadian rhythms, pupil responses, and alertness.
These systems do not operate as isolated switches. Instead, they work together as an interacting system, allowing light to influence not only what we see, but also how our bodies respond.
Three Types of Light-Sensitive Cells, Each With a Distinct Role
Rods are sensitive to dim environments, helping us perceive shapes and movement under low light levels. Cones enable us to distinguish colors and see fine details in brighter conditions. ipRGCs, meanwhile, contain melanopsin and also receive input from both rods and cones.
This means that “non-visual responses” do not occur entirely outside the visual system, nor are they driven by a single wavelength alone. This is why CIE S 026 established five categories of α-opic metrics, each corresponding to the spectral sensitivity of the S-cones, M-cones, L-cones, rods, and melanopsin-mediated pathway.
In practical lighting applications, we most often discuss melanopic stimulation, meaning stimulation related to melanopsin. But “most commonly used” does not mean “the only one that matters.” Reducing the body’s response to a single blue-green wavelength range is still an oversimplification.
Why the Same Spectrum Doesn’t Always Feel the Same
The light entering the eye passes through the cornea, lens, and vitreous humor. As we age, the lens typically absorbs more short-wavelength light. Pupil size, field of view, and the direction from which light enters the eye can also change the effective stimulus. Two people of different ages standing in the same space may measure the same ambient illuminance, but that does not mean their retinas receive exactly the same signal.
Another often-overlooked factor is the visual field. A bright ceiling with a dark field of view in front of you can provide a very different stimulus from having a bright window directly in front of you—even when the illuminance measured on the desk is identical.
This is why health-oriented lighting design needs to move beyond “lighting the desk” toward “lighting the person.”
Two Sets of Tasks in the Same Space
In a classroom, students need to see their books, the board, and screens clearly—that is the visual task. They also need an appropriately bright environment in the morning to support alertness and a stable daily rhythm—that is the circadian-related task. The two can work together, but they are not always achieved through the same measurement point, the same light source, or the same control strategy.
Good lighting design should first address glare, uniformity, color rendering, and visual performance, and then consider light exposure in the direction of the eyes. A new metric should not be used to replace all the established requirements.
What We Can Say Today / What We Cannot Yet Say
What we can say: The human eye contains multiple types of photoreceptors involved in both visual and circadian-related responses. The spectrum, intensity, direction, and duration of light exposure all influence the signals received by the body.
What we cannot yet say: ipRGCs are not a standalone “biological clock button,” nor can we assume that simply increasing a particular band of blue light will produce a predictable or identical physiological response in everyone.
Three Things You Can Do Today
When assessing a space, look at both the work plane and the directions people commonly look toward.
When discussing melanopic metrics, clarify that they are one part of the five α-opic photometric quantities.
For children, older adults, and night-shift workers, document the specific user conditions rather than applying a generic “average adult” model.
Evidence status: Established consensus. Multiple retinal pathways contribute to both the visual and non-visual responses to light; specific health outcomes are influenced by multiple factors.
References
CIE S 026:2018 :https://www.cie.co.at/publications/cie-system-metrology-optical-radiation-iprgc-influenced-responses-light-0





 English
  Chinese (Taiwan)
  Chinese (China)
  German