Design intent is a claim. Eye-level readings are evidence.
Adequate illuminance does not necessarily mean adequate eye-level mel-EDI. A control command has been issued, but that does not mean the light has actually reached its intended destination.
The latest In. Licht pro software update brings guided on-site surveys, circadian lighting references and traceable reporting together in a single workflow.
From “Delivery Complete” to “Verification Complete”
For many years, lighting projects have often reached acceptance testing with a few familiar statements:
- All the lights are on.
- The lighting scenes can switch correctly.
- The illuminance simulation looks fine.
But real spaces do not exist only in drawings.
At 17:45 on the same day, Stockholm may already be in darkness while Singapore still receives natural daylight. Even within the same office, people sitting near windows and those sitting farther away may receive completely different levels of human-centric light.
This is precisely what the latest in.licht pro software update aims to address:
Not only showing you where the light is, but also helping you determine whether it is truly serving people.

01 | Understand “What Light Are We Getting Now?” Before Asking “Is This What We Intended?”
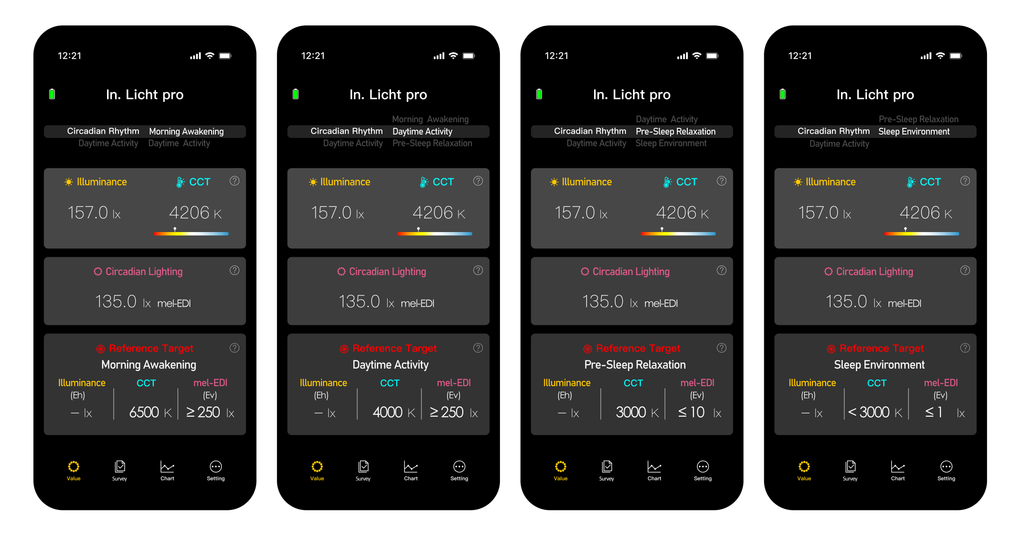
The updated In. Licht pro displays illuminance, correlated colour temperature (CCT) and mel-EDI together in one view. It also introduces scene labels that better reflect everyday circadian rhythms:
- 晨间唤醒
- 日间活动
- 睡前放松
- 睡眠环境
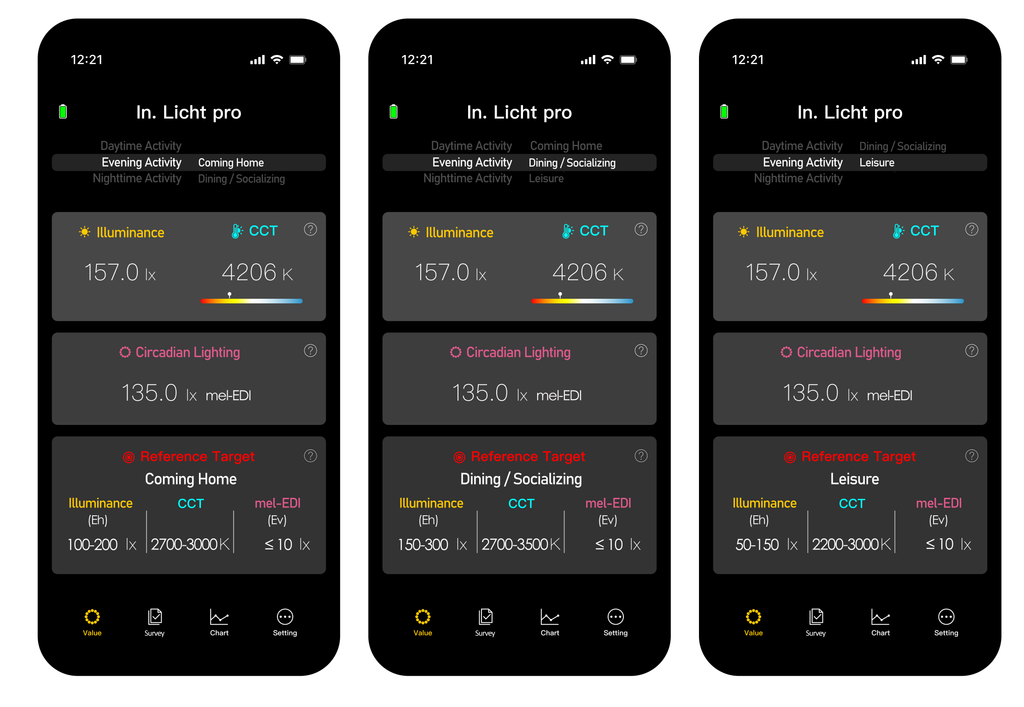
For situations such as returning home, dining and socialising, or relaxing, it also provides reference ranges based on target values.
The value is not that the instrument makes decisions for designers, but that it helps them make on-site judgements more quickly.
Is a desktop reading of 157 lx at 4206 K sufficient?
Does an eye-level mel-EDI of 135 lx better suit daytime activity, or has the environment already entered a lower-stimulation evening phase?
As evening approaches, has the lighting actually been reduced to the intended level?
In other words, it turns discussions such as “I feel it is a little too bright” or “It seems a little too dim” into measurable lighting conditions that can be compared and retested.

02 | Introducing the New Survey Module: Three Longstanding Questions, One Guided Workflow
Illuminance Ratio / Illuminance Contrast / Glazing Transmission
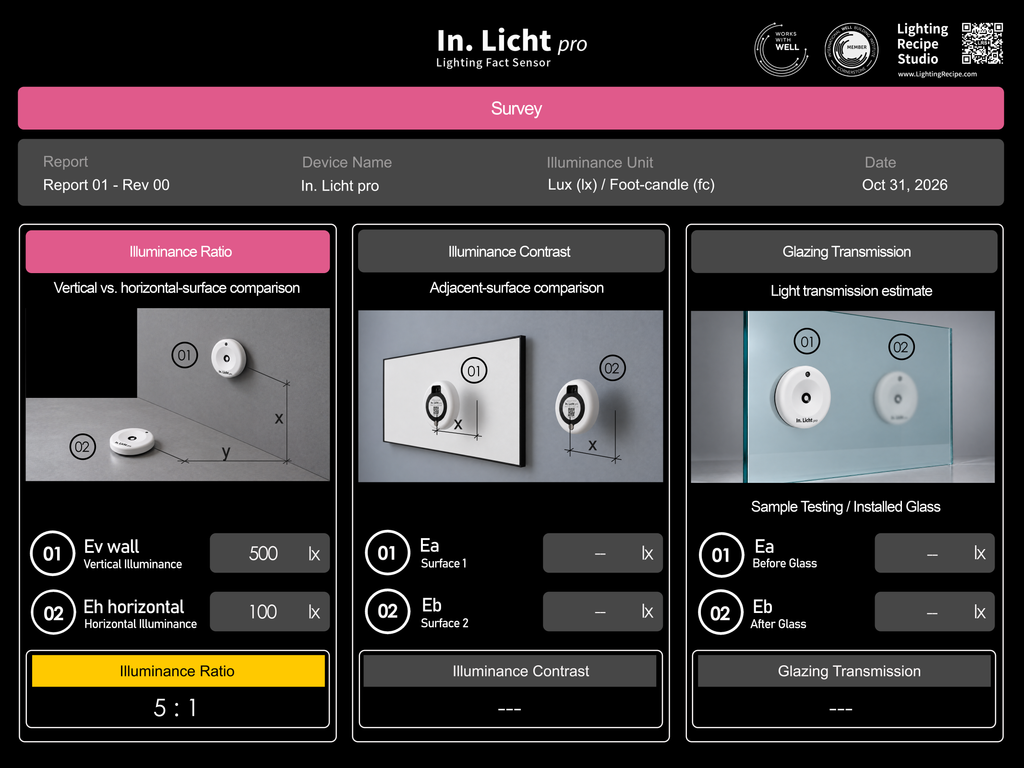
The most noteworthy addition in this update is the new Survey module. It turns three questions frequently raised on site — yet often difficult to measure clearly — into a guided, three-step workflow.
① Illuminance Ratio: Vertical Illuminance vs. Horizontal Illuminance
Vertical illuminance of 500 lx ÷ horizontal illuminance of 100 lx = 5.0.
This answers an important question: Are the brightness levels of walls and the visual field balanced with those of desks and floors?
If the ratio is too high, a space may feel oppressive or monotonous, with bright desktops surrounded by dark areas. A more appropriate ratio can create a more comfortable and visually balanced environment.
Previously, this judgement often depended on experience and walking around the space. Now, measure at the relevant vertical surface and then at the desktop to obtain a result in approximately 10 seconds.
② Illuminance Contrast: Comparing Adjacent Surfaces
Surface 1 measures 500 lx and Surface 2 measures 100 lx, producing a contrast ratio of 0.20.
This helps assess whether the visual hierarchy between a desktop and its background, an exhibit and its wall, or a task surface and neighbouring surfaces is clear.
Too little contrast can make a space feel visually flat. Excessive contrast can contribute to visual fatigue and may increase the risk of uncomfortable glare.
For exhibition spaces, offices and retail environments, where directing visual attention is important, this measurement can be particularly useful.
③ Glazing Transmission: Estimating Light Transmission Through Glass
The illuminance before the glass is 300 lx, while the illuminance after the glass is 225 lx, giving an estimated light transmittance of approximately 75%.
This answers a practical question: How much of the daylight promised by a curtain wall, skylight or glass partition actually enters the space?
Glass type, dirt, shading and window films can all reduce daylight transmission. The amount of daylight assumed in a design simulation may differ from what is delivered in reality — and the glass itself can be part of the reason.
This measurement helps make that difference visible.
What makes the upgraded workflow better?
Guided, step-by-step measurements
Each workflow is divided into Steps 01 and 02. On-screen plan and elevation diagrams guide users through where to go and what to measure. New users can follow the process without extensive training, while experienced users no longer need to memorise every step.
Immediate visual feedback
Results appear in circular gauges, with key values highlighted. Figures such as 5.0, 0.20 and 75% are easy to read and discuss with clients and contractors on site.
Clear measurement locations
Diagrams identify the appropriate sensor position — whether on a desktop, at eye level or on either side of glass. Measurements are taken at the intended locations rather than wherever it happens to be convenient.
One-tap PDF export
Every measurement page includes a PDF button in the upper-right corner. Reports can be generated immediately after measurement and added to acceptance documents and project records, making documentation easier.
One screen, one task
The bottom navigation provides four sections: Value, Survey, Chart and Setting. Readings, surveys, trends and settings each have their own place, helping users maintain their workflow without interruption.
What does this change for the industry?
On-site tasks that once depended on experience, handwritten notes and subsequent manual processing are streamlined into a standardised, repeatable and traceable workflow.
It is faster and less likely to overlook important checks — precisely what lighting acceptance testing often needs.
03 | From Manual Capture to Continuous Tracking: Reports That Finally Tell the Full Story
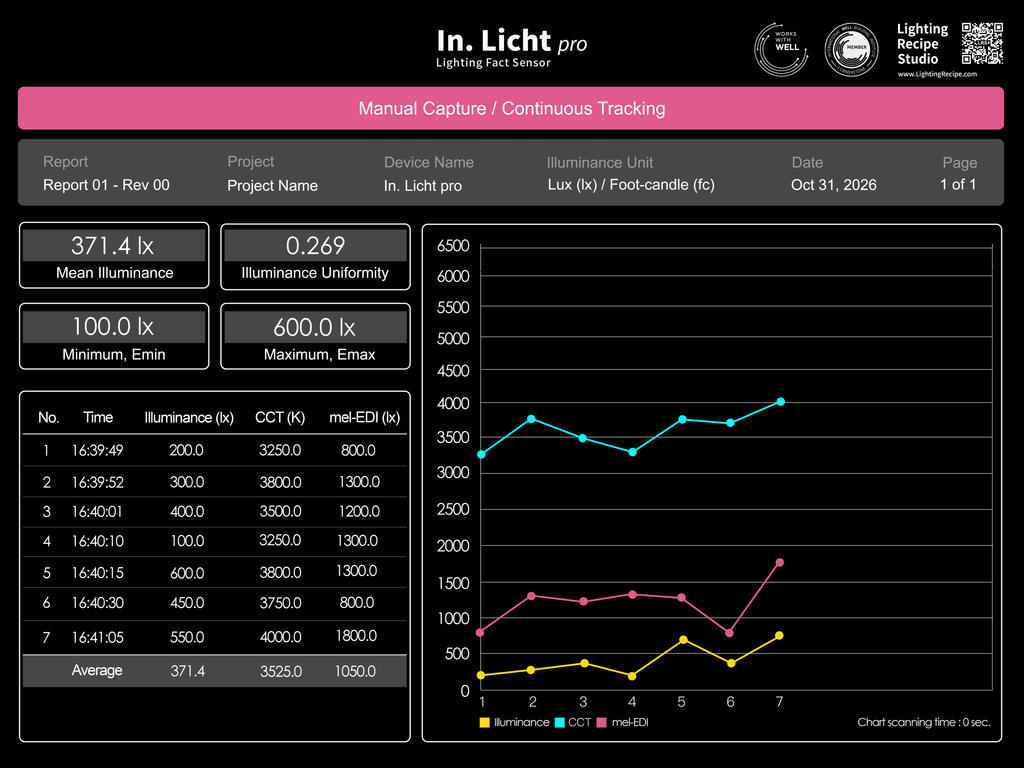
The updated reporting page supports both manual, single-point recording and continuous trend tracking.
Reports include:
- Mean Illuminance
- Illuminance Uniformity
- Minimum and maximum illuminance (Emin / Emax)
- Point-by-point tables for illuminance, CCT and mel-EDI
- Three key trend curves
This is an important step for the industry. It creates the opportunity for a clear, traceable chain throughout a lighting project:
Design Intent → Control → Delivery → Measurement → Verification
Control commands only represent what the system claims it will deliver. Measurements showing the light that actually reaches people’s eyes and supports their daily activities provide evidence that can be checked.
The essence of the in.licht pro update is to make this closed-loop process simpler, clearer and more repeatable.
04 | Three Direct Benefits for the Industry
For lighting designers
Designers can move beyond one-time simulations and bring reference targets into the actual space, quickly checking whether the design intent has been realised.
Designers are not being replaced by AI. Instead, they can take a more upstream role by defining the experience, objectives and boundaries that technology should serve.
For contractors and system integrators
Acceptance discussions become shorter, and rework can be reduced. Disagreements no longer have to remain at the level of “your impression versus mine.” Instead, they can be discussed through repeatable measurements of illuminance, CCT, mel-EDI, illuminance ratio, contrast and glazing transmission.
For luminaire manufacturers, lighting-control providers and facility operators
Healthy lighting becomes more than a discussion about spectra, circadian rhythms and smart controls. It can be continuously tracked, inspected and optimised.
In the future, evaluating a lighting system should involve more than counting how many luminaires it can control. It should also answer this question:
Today, in this space, at this time, what light is actually reaching this person’s eyes?
05 | One Simple Principle Can Determine How Far Smart Lighting Goes
With this update, we also want to emphasise an important boundary:
The person can say no. The room listens.
People can decline. Their environment should respect that choice.
A system may recommend reducing light stimulation in the evening. But if someone chooses to maintain the lighting temporarily because they need to work late, the system should respect that decision and adapt within its designed operating boundaries.
The truly advanced lighting of the future will not simply know how to control light. It will also know when not to overstep.
As lighting becomes more responsive to people, people must also have the ability to verify the light.
The latest In. Licht pro update is not intended to deliver a flashier dashboard. It is designed to offer the industry a more reliable way of working:
To make design more responsive to people, technology more respectful of people, and every lighting handover scientifically verifiable.
Good Light for a Better Life.

 English
 Chinese (Taiwan)
 Chinese (China)
 German