How to Use a Spectrometer (Measurement Distance)
For lighting designers using spectrometers (e.g., devices like the In. Licht Ultra), measurement distance impacts accuracy — and determines whether you’re capturing the light source itself, ambient/task lighting, or human-centric lighting.
What Are You Measuring?
Direct Light (Source Measurement)
Key metrics to measure include:
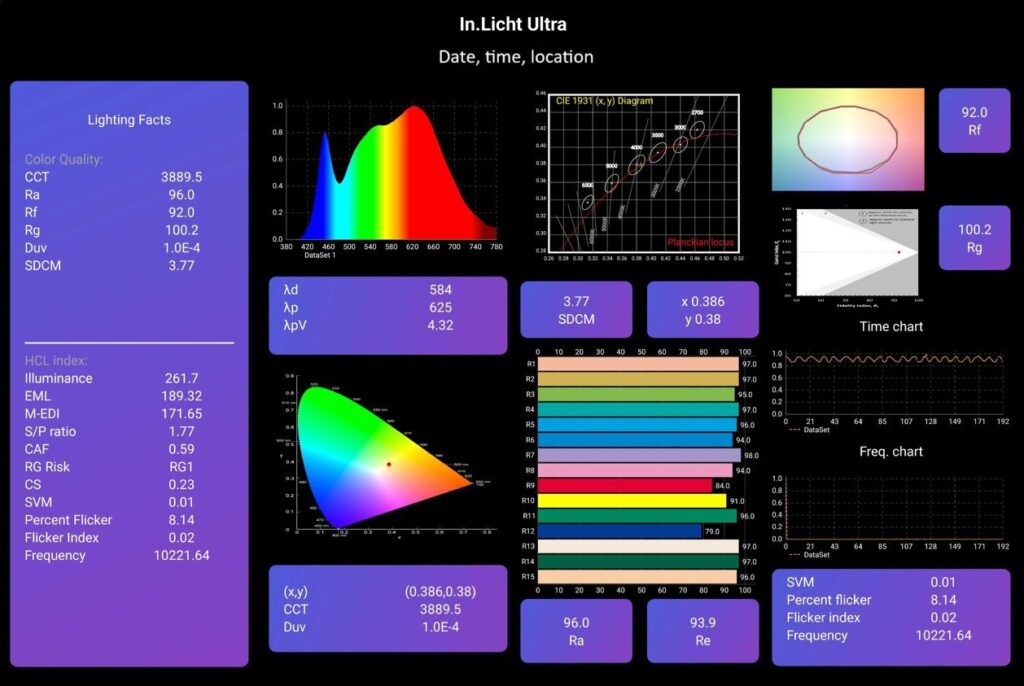
- Correlated Color Temperature (CCT)
- Spectral Power Distribution (SPD) — including dominant wavelength (λd), peak wavelength (λp), and peak intensity (λpv)
- Color Rendering Metrics — CRI (Ra and Re), and TM-30 (Rf and Rg)
- Flicker — flicker frequency, flicker percentage, flicker index, and Stroboscopic Visibility Measure (SVM)
- SDCM (MacAdam Ellipses)
- Chromaticity Coordinates (x, y) and blackbody deviation (Duv)
- Blue Light Hazard Ranking (RG)
Room Condition Requirements
1. Dark or Controlled Lighting Environment
- Ideally, perform measurements in a dark room or one with minimal ambient light to avoid stray light interference.
- If not possible, use black matte surfaces around the test area to reduce reflections.
2. Avoid Reflective Surfaces
- Remove or cover any shiny or reflective materials near the light source or sensor.
3. Measurement Angle
- Hold or position the sensor perpendicular to the emitting surface of the light source.
4. Measurement Distance
- Keep within a 10–50 cm range for general light source characterization.
- The “10–50 cm” distance is a commonly used practical guideline in lighting measurement practice, rather than a strict requirement defined by formal standards.
- For photobiological safety (Blue Light Hazard Ranking, RG), follow IEC/EN 62471: For General Lighting Service (GLS) lamps, evaluate safety at the distance where the source emits 500 lux, and no closer than 200 mm.
- Always maintain a consistent, fixed distance for repeatability.
- Ensure the sensor’s field of view fully captures the emitting area.
- Avoid shadows, obstructions, or ambient stray light during measurements.
Ambient / Task Lighting
This refers to general lighting in a space or light provided for a specific task (like reading or working).
Key Metrics to measure include:
- Illuminance (lux)
- Correlated Color Temperature (CCT)
- Color Rendering Metrics – CRI (Ra and Re), TM-30 (Rf and Rg)
- Flicker – Flicker frequency, flicker percentage, flicker index, and Stroboscopic Visibility Measure (SVM)
Room Condition Requirements:
- Ensure normal occupancy conditions (e.g., curtains/blinds as usual)
- Horizontal Surface (Desk/Workplane): Height ≈ 0.8 m (typical tabletop)
- Vertical Surface (Whiteboard/Wall Art): Position sensor perpendicular to the wall
- Take multiple readings and average the results for accuracy
Based on the WELL Building Standard v2 – Feature L02: Visual Lighting Design
To meet illuminance thresholds, the project must refer to one of the following recognized standards:
- IES Lighting Library – Lighting Applications Standards Collection
- EN 12464-1:2021 or EN 12464-2:2014
- ISO 8995-1:2002(E) (CIE S 008/E:2001)
- GB50034-2013
- CIBSE SLL Code for Lighting
WELL Performance Verification Conditions:
To ensure compliance, testing must be conducted under these controlled conditions:
- Nighttime measurements only – to eliminate daylight interference
- Supplemental lighting, if present, must be turned on and positioned on the work surface in typical usage configuration
- Each sample must be taken on the horizontal plane, with the device aperture facing upward
⚠️ Important: Ensure the shadow of the human does not fall on the device aperture during measurement
Tips: Use In. Licht Ultra’s PDF Report for WELL Submission
- In. Licht Ultra automatically generates detailed PDF reports that include all required measurement data. These PDF reports can be used directly as supporting documentation for WELL Performance Verification under Feature L02 and other light-related criteria.
Human-Centric Lighting
Key Human-Centric Metrics to measure:
- Circadian Action Factor (CAF)
- Equivalent Melanopic Lux (EML)
- Melanopic Equivalent Daylight Illuminance (M-EDI)
- Scotopic/Photopic Ratio (S/P Ratio)
- Circadian Stimulus (CS)
- Blue Light Hazard Ranking (RG)
Based on WELL Building Standard v2 – Feature L03: Circadian Lighting Design
For Workstations Used During the Daytime
- Electric lighting must achieve the following thresholds for at least 4 hours (beginning no later than noon) at a height of 18 in (≈ 45 cm) above the work plane in regularly occupied spaces
Standard thresholds:
- ≥ 150 EML [136 M-EDI] (1 point)
- ≥ 275 EML [250 M-EDI] (3 points)
For thresholds with enhanced daylight:
- ≥ 120 EML [109 M-EDI] + L05 or L06 (1 point)
- ≥ 180 EML [163 M-EDI] + L05 or L06 (3 points)
For Residential Units (Dwelling Spaces)
- In addition to the thresholds mentioned above, the lighting must be dimmable. If automated, it should dim automatically after 8:00 p.m.
Measurements must be taken:
- In living rooms and kitchens at 55 in (≈ 140 cm) in the center of the room
- In studio apartments or guest rooms, also test in the center
- For workstations, at 18 in (≈ 45 cm) above the work plane
WELL Performance Verification Conditions
WELL v2 (and later):
- Take samples at night using only electric light to eliminate daylight influence.
WELL v1:
- Part 1a: Daytime sampling between 9:00 a.m. and 1:00 p.m.
- Part 1b: Nighttime sampling using only electric light
- If supplemental lighting is present, it must be turned on and positioned according to typical use.
Sampling Position:
- Measure on the vertical plane at 45 cm (18 in) above the work plane, with the aperture facing the direction of gaze
- Light levels must be measured on the vertical plane at eye level to simulate the light entering the eyes
- Use a tripod and ensure a stable surface
- Avoid casting human shadows on the sensor
- Where no working planes are present , take 4 measurements in the center of the space at 140 cm (55 in) in orthogonal directions. The median value of the four measurements constitutes one sample point.
Reporting & Compliance
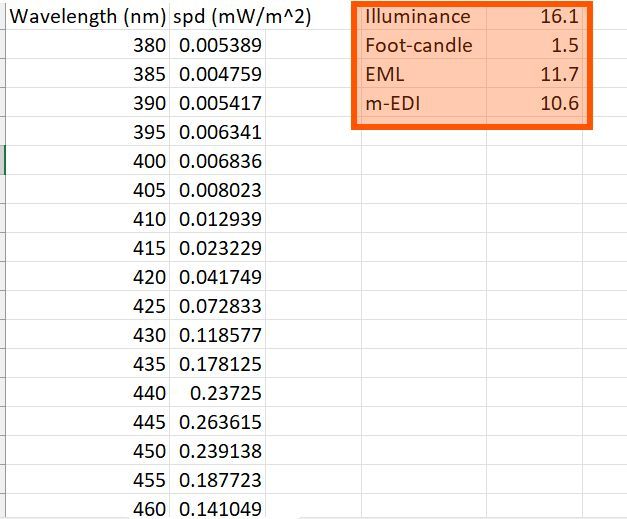
- Report the illuminance levels in lux and the spectral power at 5 nm increments from 380 nm to 730 nm.
WELL Submission Tip
- The CSV report generated by In. Licht Ultra includes all required WELL metrics and can be used for WELL Performance Verification.
How to take care of your light meter/spectrometer
Taking care of a light meter or spectrometer is essential to maintain accuracy and extend its lifespan. These devices are sensitive instruments, so proper maintenance is crucial.
Here’s a guide to help you care for them:
Keep the Sensor Clean
- Dust, dirt, and smudges on the sensor can interfere with light measurements, leading to incorrect readings.
- Gently clean the sensor with a soft, lint-free cloth or a lens cleaning brush. If the sensor is exposed to moisture, use a dry cloth to wipe it off. Be careful not to scratch the sensor.
Use in Appropriate Conditions
- Spectrometers and light meters are designed for specific measurement conditions, and using them in extreme environments can lead to inaccurate readings or damage.
- Always use the device within its specified temperature, humidity, and light-intensity ranges. Check the manual for environmental specifications and avoid exposing the instrument to conditions outside of those ranges.
Store Properly
- Exposure to extreme temperatures, moisture, or physical shock can damage your device. Dropping or rough handling can damage the delicate internal components, including the sensor and optics. Be cautious not to drop it or expose it to heavy impacts.
- Always handle the device with care. Store the light meter or spectrometer in a protective case when not in use. Keep it in a cool, dry place away from direct sunlight, humidity, and extreme temperatures.
Battery Care
- Dead or corroded batteries can cause the device to malfunction.
- Check the battery regularly and replace it with fresh, recommended batteries as needed. If you’re not using the device for a long period, remove the batteries to avoid leakage and corrosion. Store the device in a place where the temperature is within the recommended range for battery life.
Perform Regular Functional Tests
- Regular testing ensures that the device continues to perform as expected.
- Periodically run the spectrometer or light meter under known light conditions and verify its readings. If discrepancies are noted, calibrate the device or seek professional servicing if necessary.
Follow the Manufacturer’s Guidelines
- Each device may have specific care instructions and operational limits.
- Read the user manual carefully for specific maintenance and usage guidelines. Follow the manufacturer’s recommendations for cleaning, calibration, and storage to maximize the longevity and accuracy of the instrument.
Proper care extends the life of the device and improves its performance, saving you time and money in the long run.
Lighting Fundamentals: A Quick Guide
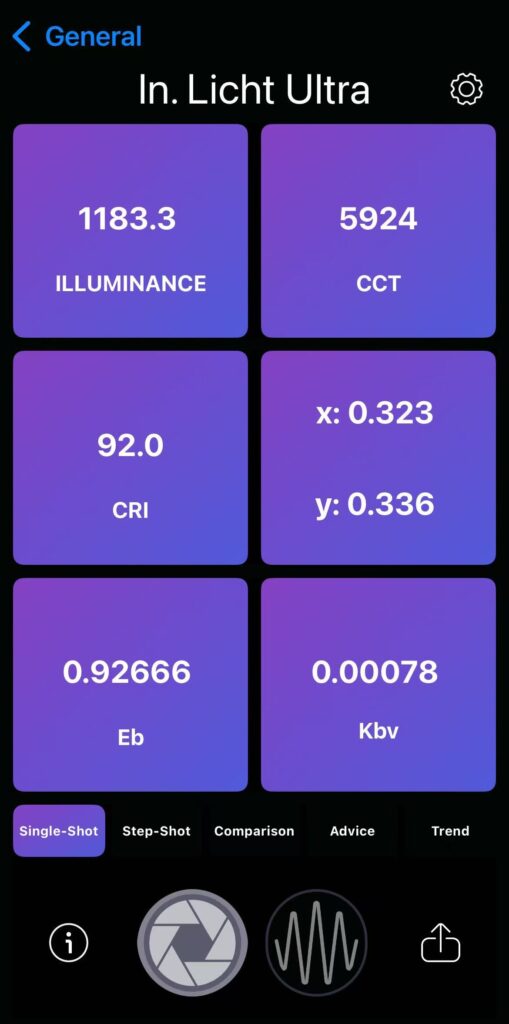
Illuminance
Illuminance refers to the total luminous flux incident on a surface, per unit area. It measures how much light falls on a surface, weighted by the human eye’s sensitivity to different wavelengths (the luminosity function). In simple terms: Illuminance is the amount of light that falls on a given surface.
The SI unit of illuminance is lux (lumens per square metre). A foot-candle, used in regions following United States customary units, is another unit of illuminance and is equal to one lumen per square foot—approximately 10.764 lux.
CCT (Correlated Color Temperature)
Correlated Color Temperature (CCT) describes the color appearance of a light source, based on the temperature (in Kelvin) of an ideal black-body radiator emitting a similar hue. In simpler words: CCT tells us whether a light source appears warm (yellow/red tones) or cool (blue tones), based on its temperature.
The SI unit is Kelvin (K).
- Warm and Cozy (2200K–2700K): Creates a relaxed, inviting atmosphere. Ideal for homes, bedrooms, and dining spaces.
- Neutral White (3000K–3500K): A balanced light used for general illumination in offices, kitchens, and retail spaces.
- Cool White (4000K–4500K): Sharp, focused lighting suited for tasks, workstations, and garages.
- Daylight/Outdoor (5000K–6500K): Mimics daylight; perfect for outdoor lighting, parking areas, and sports facilities.
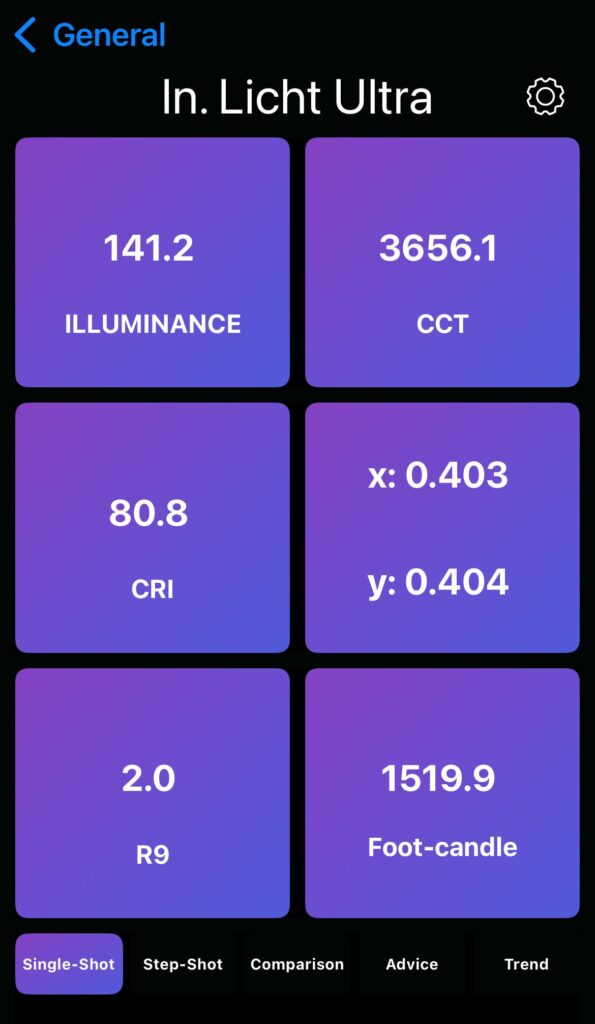
CRI (Color Rendering Index)
The Color Rendering Index (CRI) quantifies how accurately a light source reveals the true colors of objects compared to a reference light, such as natural daylight. The CRI is determined by the light source’s spectrum.
The index is measured from 0 to 100, with a perfect score of 100 indicating that the colors of objects under the light source appear the same as they would under natural sunlight. Typically, light sources with a CRI of 80 to 90 are considered good, and those with a CRI of 90+ are considered excellent.
General rule: The higher the CRI, the better the color rendering capability.
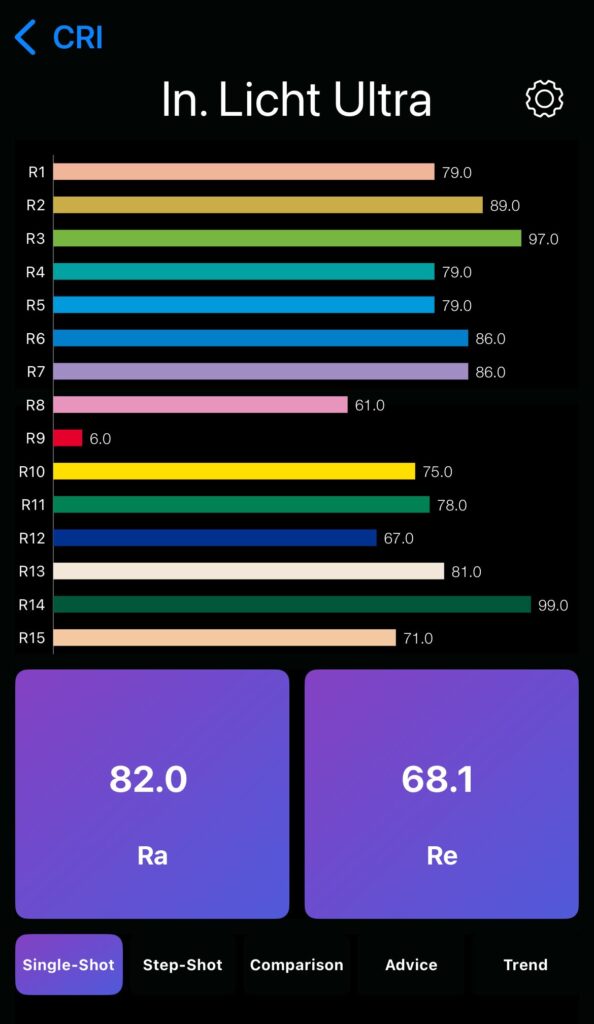
The most commonly used CRI value is CIE Ra. The color rendering index Ra (general reference) is calculated from the mean of the first eight test colors (R1–R8). According to the EN 12464-1 lighting standard, a minimum Ra value of ≥ 80 is required for most activities. Other test colors (R9 to R15) are not included in the Ra calculation. These include: R9 – saturated red, R13 – skin color (light), and R15 – skin color (medium). This means a light source could have a high CRI score but still perform poorly when rendering red tones. That’s why lighting professionals often look at the R9 value in addition to the CRI.
The average of all 15 test colors is expressed as the Re value (reference extended), which enables a more precise evaluation of light quality.
TM-30: A Modern Approach to Color Rendering Evaluation
The IES TM-30 is a color rendering evaluation method introduced by the Illuminating Engineering Society (IES) in 2015 to overcome the limitations of the traditional Ra (CRI) metric. TM-30 offers a more comprehensive and accurate approach to assessing the color rendering performance of a light source, providing a much deeper insight than conventional indices like Ra.
Unlike CRI, which only uses 8 color samples, TM-30 evaluates 99 color samples—resulting in a more robust and realistic assessment of how a light source renders colors.
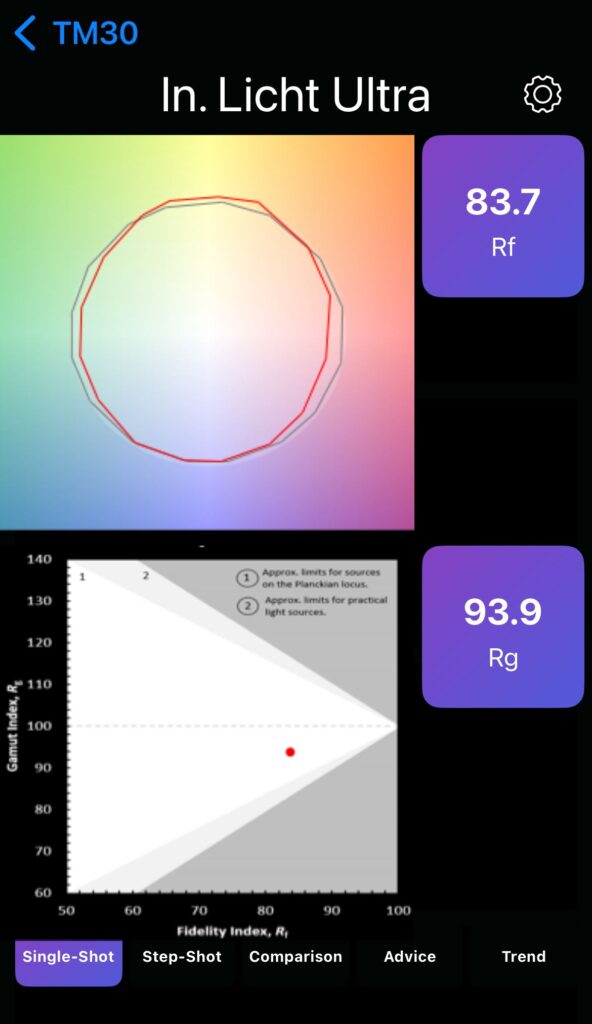
Color Fidelity Index (Rf)
The Rf measures how accurately a light source reproduces colors compared to a reference light source—similar to the CRI method but using TM-30’s expanded 99 color samples. A higher Rf score indicates better color accuracy, with a perfect score of 100 representing a light source that renders colors identically to the reference source.
Gamut Index (Rg)
The Rg measures the saturation of colors rendered by a light source compared to a reference. It provides valuable information about the intensity and vibrancy of colors.
- Rg = 100: Matches the reference source’s color saturation
- Rg > 100: Indicates oversaturation (colors appear more intense)
- Rg < 100: Indicates desaturation (colors appear more muted)
Together, Rf and Rg provide a complete picture of a light source’s color performance, with Rg adding valuable information on color vividness and intensity.
Color Vector Graphic
While Rf and Rg provide numeric values, the Color Vector Graphic gives a visual representation of color saturation differences.
- Black circle = Reference light
- Red shape = Test light
- Red lines inside the black circle = Desaturation of those hues
- Red lines outside the black circle = Oversaturation of those hues
- Overlapping lines = No change; hues are rendered the same
Rf-Rg Plot Graph
This plot simply graphs Rf against Rg, offering a clear visual comparison of color rendering quality across different light sources. It’s a practical and insightful tool for evaluating and selecting lighting.
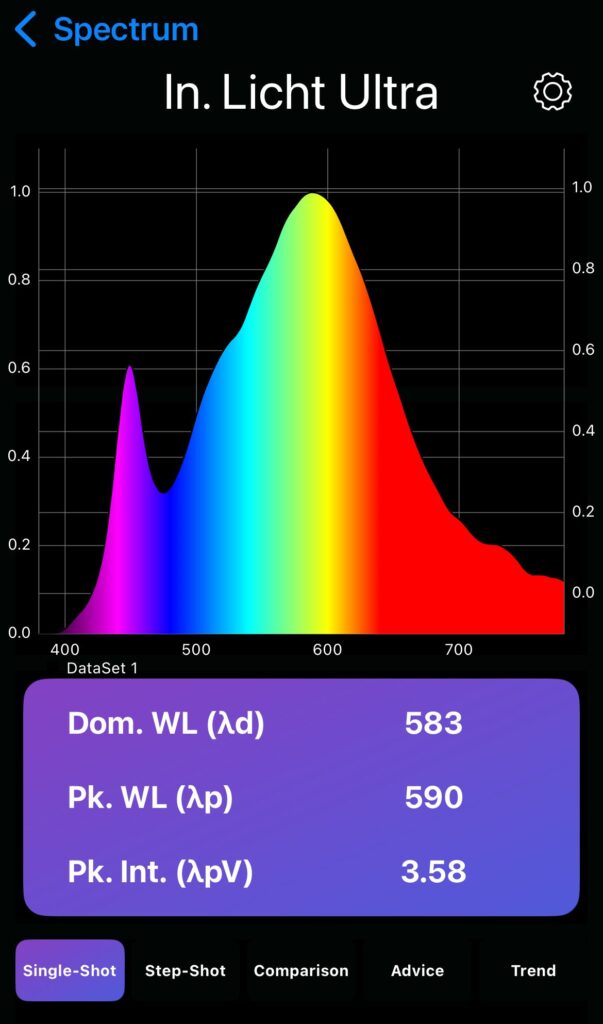
Spectrum
A spectrum refers to the range of different wavelengths of light (or other types of electromagnetic radiation) emitted by a source. In lighting and color science, the light spectrum shows how much light is being emitted at each wavelength, from short (blue/violet) to long (red) wavelengths.
The visible spectrum is the portion of the electromagnetic spectrum that humans can see—approximately from 380 to 780 nanometers.
A light spectrum diagram, similar to a graph, visually represents the distribution of light across different wavelengths (or colors). It typically shows the intensity of light at each wavelength, helping you understand the composition of the light source.
- The x-axis usually represents wavelength in nanometers (nm)
- The y-axis represents the relative intensity or energy of the light.
Spectral Power Distribution (SPD)
The spectral power distribution (SPD) of a measured light source refers to the range and intensity of wavelengths emitted by the source within the visible light spectrum, typically from approximately 380 nanometers to 780 nanometers. The SPD is the true “fingerprint” of a light source, as it is the key to how the light source renders colors.
The SPD characterizes how much power the light emits at each wavelength, influencing the perceived color and quality of the light produced. SPD measurement describes the power per unit area per unit wavelength of an illumination.
Wavelengths (λ)
A wavelength is the horizontal distance between two peaks of a wave. Light is measured by its wavelength, expressed in nanometers (nm).
Dominant Wavelength (λd)
The dominant wavelength refers to the specific wavelength of light that appears most prominent or representative in a color composed of a mixture of wavelengths. It indicates the perceived hue of the light.
Peak Wavelength (λp)
This is the wavelength at which the light spectrum reaches its maximum intensity. It can be identified as the highest peak in a spectrum graph.
Peak wavelength indicates the brightest part of the light spectrum.
Dominant wavelength, on the other hand, represents the color we perceive from the light.
Peak Intensity (λpv)
This is the actual intensity value at the peak wavelength. It shows how much light is being emitted at that specific wavelength.
Chromaticity
Chromaticity is a way of describing the color of light, regardless of how bright that light is. In technical terms, it’s the objective measurement of hue and saturation, without considering luminance (brightness). So while brightness tells you how intense a light is, chromaticity tells you what color it is.
It’s usually represented using coordinates on a chromaticity diagram (like the CIE 1931 diagram), which maps colors based on their spectral.
In short:
- Hue = the type of color (red, green, blue, etc.)
- Saturation = how vivid or dull the color is
Chromaticity can be represented as coordinates calculated from the Spectral Power Distribution (SPD) using a color diagram published by the International Commission on Illumination (CIE). The CIE 1931 chromaticity diagram uses (x, y) coordinates to map chromaticity. A pair of these coordinates provides a numerical representation of a light source’s color.
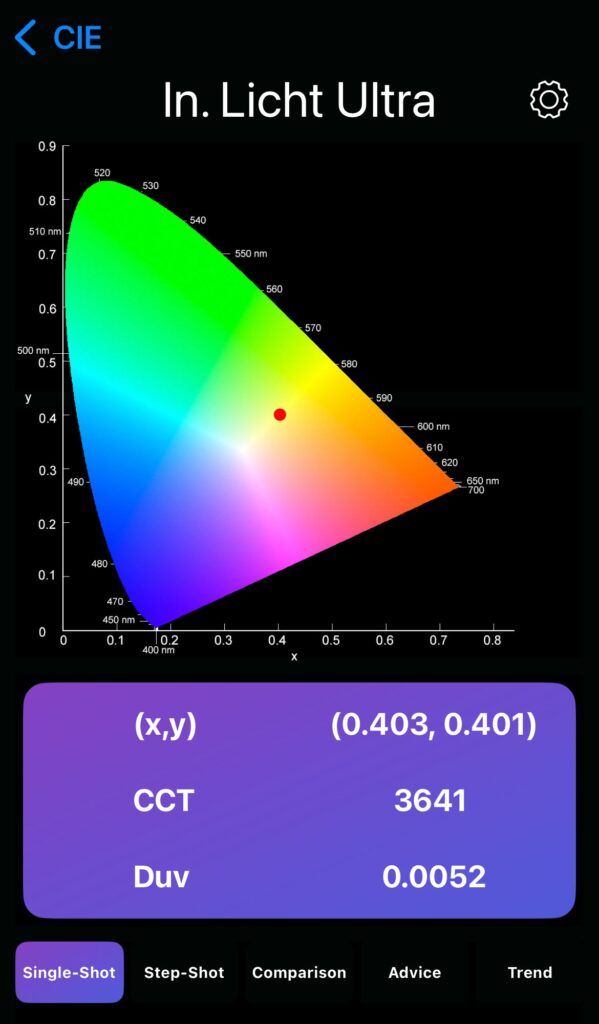
Duv
Duv (short for “Δu,v Distance”) is a measure used in lighting to describe the deviation of a light source’s color from the blackbody locus on a chromaticity diagram. The blackbody locus represents the colors of light emitted by an ideal blackbody radiator at various temperatures, which are generally perceived as natural and pleasing by the human eye.
Duv quantifies the distance between a light source’s chromaticity and the nearest point on the blackbody locus in the CIE 1960 (u,v) chromaticity diagram.
- A positive Duv indicates the chromaticity is above the blackbody locus (often resulting in a greenish tint).
- A negative Duv indicates the chromaticity is below the blackbody locus (often resulting in a pinkish or magenta tint).
- A Duv of zero means the color lies exactly on the blackbody curve—this is considered ideal white light. Light sources with a Duv close to zero are generally preferred, as they produce light that appears more natural.
Typical recommended Duv range:
- General lighting: –0.006 to +0.006
- High-quality lighting: –0.003 to +0.003
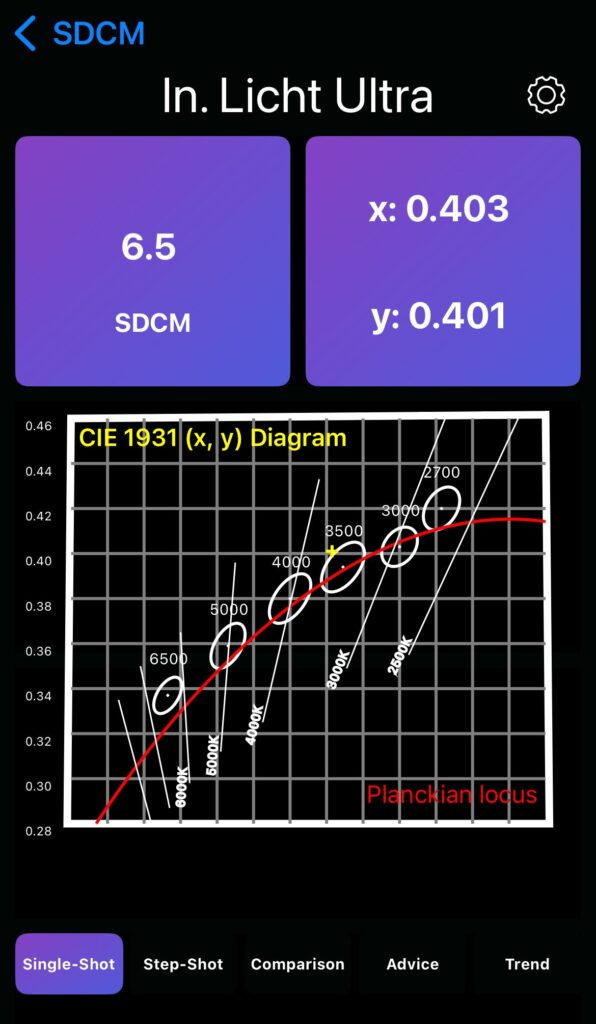
SDCM (Standard Deviation Color Matching)
SDCM has the same meaning as a MacAdam ellipse. It’s a unit used in lighting to describe how much a color deviates from a reference color. SDCM defines a zone in the CIE (x, y) color space within which people can perceive color variations at a given color temperature.
The American standard ANSI C78.376-2014 specifies reference points and sizes for six MacAdam ellipse sets, each corresponding to a specific color temperature.
The higher the SDCM number, the greater the color deviation and the more noticeable the difference. Conversely, a lower SDCM number indicates a smaller, less perceptible color shift.
In simple terms:
- 1 SDCM: No visible color difference
- 2–3 SDCM: Barely noticeable
- 4+ SDCM: Clearly noticeable
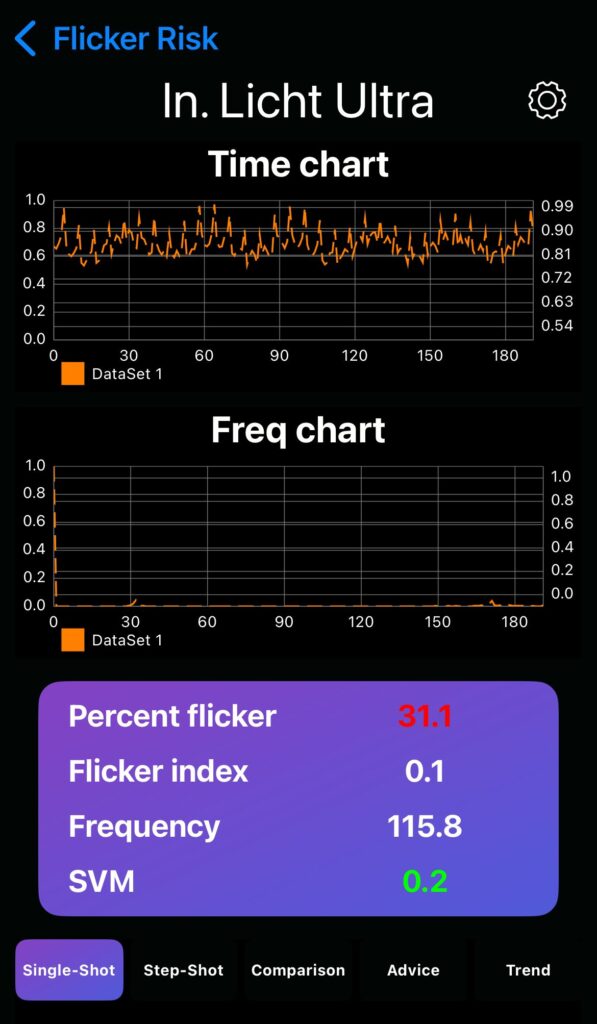
Flicker
Flicker refers to variations in luminance over time—rapid changes in light intensity or brightness, making the light appear to fluctuate or pulse.
Flicker Frequency
Human response to flicker depends on frequency, measured in Hertz (Hz), indicating how often a light source switches on and off or varies in intensity per second. One Hz equals one cycle or flicker per second. As the frequency increases, changes in brightness between minimum and maximum levels become less noticeable to the eye.
- 3–70 Hz: Flicker is clearly visible.
- Up to ~100 Hz: Flicker is noticeable to most, depending on light conditions.
- 100–200 Hz: Flicker is less noticeable but may be subconsciously detected.
- Above 200 Hz: Flicker is not perceptible to the human eye.
Flicker Measurement
Two common ways to measure flicker are percent flicker (modulation %) and flicker index.
Percent flicker measures the magnitude of perceived flicker. It is calculated by taking the difference between the maximum and minimum light output during a single cycle, dividing it by their sum, and expressing the result as a percentage.
Formula:
Flicker % = 100 × (A – B) / (A + B)
A= Maximum Value
B= Minimum Value
0% = no flicker; 100% = highest flicker.
IEEE 1789 is the most widely used standard for regulating flicker in LEDs.
Recommended Practice 1 (RP1):
- Below 90 Hz: Modulation (%) < 0.025 × frequency
- 90 to 1,250 Hz: Modulation (%) < 0.08 × frequency
- Above 1,250 Hz: No restriction on modulation (%)
Recommended Practice 2 (RP2 – for NOEL):
- Below 90 Hz: Modulation (%) < 0.01 × frequency
- 90 to 3,000 Hz: Modulation (%) < 0.0333 × frequency
- Above 3,000 Hz: No restriction on modulation (%)
Most LED fixtures flicker at twice the mains frequency (50 Hz in Europe, 60 Hz in the USA and Canada), leading to these typical flicker values:
50 Hz mains (100 Hz flicker):
- *RP1 (Good): Max modulation = 8.0%
- *RP2 (Best): Max modulation = 3.3%
60 Hz mains (120 Hz flicker):
- RP1 (Good): Max modulation = 9.6%
- RP2 (Best): Max modulation = 4.0%
Flicker index is calculated by determining the average light output during a cycle, then measuring the area above and below this average. The index is the ratio of the area above the average to the total area.
Formula:
Flicker Index = Area above average / (Area above + Area below)
Ranges from 0 to 1; lower values = less visible flicker.
Advanced Metrics: PstLM and SVM
PstLM (Short-Term Light Modulation)
Applies to flicker in the 0–80 Hz range. A value of 1.0 means a 50% chance that an average observer will perceive flicker. A value of 0 is ideal; values ≤1.0 are acceptable.
SVM (Stroboscopic Visibility Measure)
Covers the 80–2,000 Hz range. An SVM of 1.0 is the visibility threshold for an average observer.
An LED luminaire is considered flicker-free if: SVM ≤ 0.4 and PstLM ≤ 1.0
Light enters the eyes through the cornea, where it is then focused onto the retina. The retina contains millions of light-sensitive cells called photoreceptors, which are divided into two types: rods and cones.
Scotopic Vision
Scotopic vision refers to vision in dim lighting conditions, such as at night. In these low-light environments, the eyes primarily rely on rod cells, which are highly sensitive to light but do not detect color or fine detail. Scotopic vision is most sensitive to the color blue, but it has a very limited ability to distinguish colors overall. Rods function effectively at luminance levels below approximately 0.005 lux.
Photopic Vision
Photopic vision occurs under bright light conditions, such as daylight or artificial lighting. In these situations, the eyes rely on cone cells, which are responsible for color perception and visual acuity. Photopic vision provides excellent color discrimination. Cones function best at luminance levels above approximately 5.0 lux.
Mesopic Vision
What we typically consider “normal” vision is actually a combination of scotopic and photopic vision. This overlapping region is known as the mesopic range, where both rods and cones contribute to visual perception.
The S/P Ratio
The S/P ratio is particularly important under scotopic conditions, where rod cells dominate visual perception. The S/P ratio is a multiplier that indicates how much of the emitted light is effective for human vision. These are referred to as visually effective lumens (VELs). A recommended S/P ratio falls between 1.8 and 2.0.
Generally, white light sources have high S/P ratios, while yellow or orange light sources tend to have low S/P ratios.
Blue Hazard Ranking
The Blue Hazard Ranking measures the risk that a light source poses to eye safety, particularly in relation to exposure to blue wavelengths.
Blue light is a type of high-energy visible (HEV) light, which refers to the blue portion of the visible light spectrum. Its potentially harmful effects are mainly concentrated in the 380 nm to 450 nm range. Blue light in the 450 nm to 500 nm range can offer certain benefits. In moderate amounts, blue light contributes to overall well-being and vitality. However, excessive blue light exposure can cause oxidative stress in retinal cells, leading to irreversible photochemical damage and worsening of cell injury in the macula. This is commonly referred to as the “blue light hazard.”
The IEC 62471 standard defines the method for assessing the blue light risk from light sources and luminaires. Based on this standard, products can be classified into the following risk groups:
- RG0: No risk
- RG1: Low risk
- RG2: Moderate risk, requiring warning labels
- RG3: High risk — even brief exposure to the light source can cause damage. Luminaires in this category are generally not permitted.
The lighting industry now recognizes the non-visual effects of light on health and circadian rhythms, driving the development of standardized metrics for optimal melanopic lighting across various settings. The two most widely used are M-EDI and EML, both of which measure light’s biological impact—especially around the blue-light spectrum (~480 nm).
M-EDI (Melanopic Equivalent Daylight Illuminance)
The International Commission on Illumination (CIE) recommended a circadian metric called M-EDI. It quantifies the amount of light exposure from a source that stimulates melanopsin-based photoreception in the retina, and it shares the same fundamental methodology as EML. This metric determines how much daylight would be required to produce the same biological impact as a given lighting condition. The key difference is that the magnitude of M-EDI is expressed as the illuminance of the CIE standard illuminant D65 that delivers the same stimulus to ipRGCs. Thus, the M-EDI value can be converted from the EML value by multiplying it by a coefficient of 0.9063.
Recommended levels: Daytime: >250 M-EDI; Nighttime: <50 M-EDI
Equivalent Melanopic Lux (EML)
Another key metric is EML, introduced and popularized through the WELL Building Standard. Like M-EDI, EML measures the circadian effectiveness of light but is expressed in lux, modified to account for the sensitivity of melanopsin-containing ipRGCs, rather than the traditional photopic response of cones.
While traditional lux measures brightness as perceived by the human eye, EML adjusts the measurement to reflect the biological (non-visual) impact of light on the circadian system. It allows lighting professionals to assess how effectively a light source stimulates melanopsin receptors, which are essential for regulating the biological clock.
The WELL v2 Standard recommends at least four hours of EML lighting in the morning to effectively entrain the circadian rhythm. This exposure helps support healthy sleep-wake cycles, improve cognitive function, and enhance mood regulation.
Suggested ranges: Daytime: >150 EML; Nighttime: <50 EML
The choice between M-EDI and EML often depends on the context. M-EDI is rooted in scientific standardization and widely used in research and technical standards, while EML is application-focused and directly linked to practical health outcomes and WELL Building certification.
Circadian Action Factor (CAF)
The human eye contains various types of optic nerve cells, one of which does not process visual information but instead responds to light stimuli. When light enters the eye, this type of optic nerve cell—known as the intrinsically photosensitive retinal ganglion cell (ipRGC)—triggers non-visual biological effects. These effects significantly influence the release of hormones such as melatonin and cortisol.
When ipRGCs are exposed to high-frequency, high-energy light, they inhibit the body’s production of melatonin, making people feel alert and energized. Conversely, when exposed to low-energy light, melatonin levels gradually increase, making people feel relaxed and sleepy. Therefore, light serves as a crucial external factor affecting the human circadian rhythm.
Gall and Bieske developed the Circadian Action Factor (CAF) as an indicator of the non-visual effects that light has on human health and well-being. It is a metric that describes how a light source influences the circadian system, which governs essential processes such as sleep, alertness, and cognitive performance. This metric helps lighting designers understand how specific light exposures impact the circadian system and contribute to circadian rhythm regulation.
CAF is defined as the ratio of the amount of light affecting the circadian system to the amount of light useful for vision. It is calculated based on the light spectrum emitted by a device. Recommended CAF values vary depending on the time of day: a high CAF is typically preferred during the day to enhance alertness and cognitive function, while a lower CAF is more suitable in the evening to support relaxation and preparation for sleep. Higher CAF values correspond to greater melatonin suppression.
Compared to color temperature, CAF is a more accurate indicator for predicting the melatonin-suppressing effects of light. Preliminary studies suggest that CAF may be a more reliable index for studying the physiological effects of light on the human body.
Gall proposes ideal combinations of individual activities, the Circadian Action Factor (CAF), and the color temperature of light sources, as shown in the image below.
Circadian Stimulus (CS)
Developed by researchers at the Lighting Research Center (LRC), the Circadian Stimulus (CS) metric is a method for quantifying light’s impact on acute melatonin suppression, a marker of circadian system activation. It measures the effect of light—based on spectrum, intensity, and duration—on the human circadian system.
In contrast to the metrics proposed by the CIE (M-EDI) and IWBI (EML), the CS metric considers not only the role of ipRGCs, but also the contributions of rods and cones in non-visual physiological responses to light. Notably, the CS metric addresses the fundamental problem of subadditivity in the human circadian system. It indicates how effectively a one-hour exposure to a specific light level and wavelength stimulates the circadian system, based on its ability to suppress the hormone melatonin.
The CS value ranges from 0 (no biological effect) to 1 (maximum activation) and is calculated based on the response characteristics of melanopsin-containing photoreceptor cells in the retina. These cells regulate melatonin secretion and influence physiological functions such as the sleep-wake cycle and alertness.
By measuring CS values in real time, users can accurately assess whether their light environment aligns with the body’s natural circadian needs. For example, a high CS value during the day (recommended: 0.3–0.7) helps enhance alertness and cognitive performance. At night, the CS value should be kept below 0.1 to avoid melatonin suppression and sleep disturbances. This makes the CS metric particularly valuable for optimizing dynamic lighting systems, such as circadian-adaptive lighting solutions for workplaces, healthcare facilities, and residential environments.
Eb (Blue Light Hazard Weighted Irradiance)
Eb refers to the irradiance of blue light emitted from a small light source, such as an LED. It is measured in watts per square meter (W/m²).
Blue light irradiance (Eb) is used to calculate the maximum exposure time and to determine classification into Risk Groups. This classification is proportional to the effective irradiance at the retina.
The RG1 blue light irradiance limit is 1 W/m²—this is the threshold at which the transition from Risk Group 1 (RG1) to Risk Group 2 (RG2) occurs.
Kbv (Blue Light Hazard Radiation Coefficient)
Kbv is a metric introduced in the IEC/TR 62778:2014 standard, Application of IEC 62471 for the Assessment of Blue Light Hazard to Light Sources and Luminaires. IEC 62778 provides clarification and guidance for assessing the blue light hazard of lighting products that primarily emit in the visible spectrum (380 nm to 780 nm).
Kbv is calculated as Eb divided by the illuminance (in lux). It essentially represents the ratio of blue light hazard potential per unit of luminous energy. These metrics help quantify the potential harm of blue light, particularly to the retina.
Eb and Kbv are used by researchers to assess the photometric quantities of blue light that may pose a photobiological hazard. They form the basis for determining a product’s “Risk Group” classification. In essence, Eb and Kbv are technical tools used to quantify and understand the hazards associated with blue light emissions, particularly from various light sources, thereby aiding in the implementation of appropriate safety measures to reduce potential risks.
Air Quality Fundamentals: A Quick Guide
The Air Quality Index (AQI) is a standardized measurement used to indicate how clean or polluted the air is, and what associated health effects might be of concern.
Here’s how it works:
- Lower AQI = Better air quality
- Higher AQI = More pollution and greater health risks
AQI typically includes measurements of Particulate Matter (also called Particle pollution)—a mixture of solid particles and liquid droplets found in the air. Some particles, such as dust, dirt, soot, or smoke, are large or dark enough to be seen with the naked eye. Others are so small they can only be detected using an electron microscope.
Particle pollution includes:
- PM10: Inhalable particles with diameters generally 10 micrometers and smaller
- PM2.5: Fine inhalable particles with diameters generally 2.5 micrometers and smaller
How small is 2.5 micrometers?
Think about a single strand of human hair. The average human hair is about 70 micrometers in diameter—making it roughly 30 times larger than the largest PM2.5 particle.
What Kinds of Harmful Effects Can Particulate Matter Cause?
Exposure to both PM2.5 and PM10 is associated with a range of adverse health effects.
For PM2.5:
Short-term exposure (up to 24 hours) has been linked to:
- Premature mortality
- Increased hospital admissions (heart and lung issues)
- Acute and chronic bronchitis
- Asthma attacks
- Emergency room visits
- Respiratory symptoms
- Restricted activity days
These health effects are more commonly reported in infants, children, and older adults with preexisting heart or lung diseases.
For PM10:
Short-term exposure has been primarily linked to the worsening of respiratory conditions such as:
- Asthma
- Chronic Obstructive Pulmonary Disease (COPD)
This can lead to increased hospitalization and emergency department visits.
How Can I Reduce My Exposure to PM?
You can protect yourself by:
- Monitoring air quality alerts
- Limiting outdoor activity when PM levels are high
- Using indoor air purifiers or filtration systems
Particle pollution in the WELL v2 Building Standard (Air Concept)
The WELL Air Concept in v2 Building Standard, developed by the International WELL Building Institute (IWBI), emphasizes the importance of indoor air quality in promoting human health and well-being. One key component of this standard is the control and monitoring of particulate matter (PM)—specifically PM2.5 and PM10.
According to WELL Air Concept A05 (Enhanced Air Quality):
1 point:
- PM2.5: 12 µg/m³ or lower
- PM10: 30 µg/m³ or lower
2 points:
- PM2.5: 10 µg/m³ or lower
- PM10: 20 µg/m³ or lower
Carbon dioxide (CO₂)
CO₂ is a colorless, odorless, and non-flammable gas that naturally occurs in the atmosphere. CO₂ is produced by body metabolism and is a normal component of exhaled breath.
CO₂ is often measured in indoor environments as a quick indicator of whether additional ventilation is required. Because CO₂ is a known indoor pollutant, excessive levels can negatively affect employee performance, productivity, and overall health.
We tend to measure CO₂ in ppm (parts per million) because it is the easiest way to quantify a substance that is colorless, odorless, and invisible to the human eye.
Regular monitoring of CO₂ levels helps to:
- Ensure proper ventilation
- Reduce airborne illness transmission risks
- Improve productivity and well-being
- Maintain regulatory compliance for workplace safety
What does exposure to high CO₂ levels feel like?
Here are some common symptoms of being in an environment with elevated CO₂ levels:
- Stale air
- Difficulty breathing
- Drowsiness and fatigue
- Headaches
- Poor concentration and cognitive function
- Increased heart rate
- Nausea and dizziness
The WELL Building Standard v2 addresses carbon dioxide (CO₂) as a critical indicator of indoor air quality (IAQ) and ventilation effectiveness. According to WELL Building Standard A06 (Enhanced Ventilation Design), the following requirements apply for naturally ventilated buildings:
Implement an engineered natural ventilation system that maintains CO₂ levels in the breathing zone of all regularly occupied spaces below the specified thresholds at maximum intended occupancies:
1 Point:
- Threshold: 900 ppm OR 500 ppm above outdoor levels
2 Points:
- Threshold: 750 ppm OR 350 ppm above outdoor levels
In summary, maintaining indoor CO₂ levels within the acceptable range helps ensure good indoor air quality as well as the well-being and comfort of occupants.
Volatile Organic Compounds (VOCs)
VOCs are a group of compounds with high vapor pressure and low water solubility. In other words, these substances easily evaporate into the air and do not readily dissolve in water. Examples of VOCs include Benzene, Ethylene glycol, Formaldehyde, Methylene chloride. Tetrachloroethylene, and Toluene.
Common Sources of VOCs are household and commercial products, such as:
- Paints, paint strippers, and other solvents
- Wood preservatives
- Aerosol sprays
- Cleansers and disinfectants
- Moth repellents and air fresheners
- Stored fuels and automotive products
- Dry-cleaned clothing
- Pesticides
- Building materials and furnishings
- Office equipment
- Nail polish and nail polish removers
Total Volatile Organic Compounds (TVOC)
TVOC refers to the total concentration of all VOCs present in the air. The TVOC level is the sum of all VOC levels that impact indoor air quality. TVOC is typically measured in micrograms per cubic meter (µg/m³).
Potential Health Effects of TVOCs:
- Eye, nose, and throat irritation
- Fatigue
- Allergic skin reactions (e.g., from toluene)
- Headaches, dizziness, nausea, and loss of coordination
- Damage to the liver, kidneys, and central nervous system (with long-term, high-dose exposure)
- Some VOCs, like formaldehyde, are known carcinogens; others are suspected to cause cancer in humans
- Conjunctival (eye) irritation
- Difficulty breathing (dyspnea)
- Decreased serum cholinesterase levels
WELL Building Standard (Air Concept A01: Air Quality)
Under the WELL v2™ framework, which emphasizes performance-based design to support human health and wellness, To meet WELL criteria for continuous air quality monitoring in occupiable spaces, the following threshold must be achieved: TVOC: ≤ 500 µg/m³
Formaldehyde (HCHO / CH₂O / H₂CO)
HCHO is one of the most hazardous components among total volatile organic compounds (TVOCs). This colorless gas is commonly found in building materials and household products. Fortunately, formaldehyde has a distinct odor — it can be recognized by its strong, pungent smell.
Prolonged exposure to HCHO can damage mucous membranes, irritate the respiratory system, and is classified as a potential human carcinogen.
Due to its severe health impacts and frequent presence in indoor environments, air quality monitors often track formaldehyde separately from other VOCs.
According to the WELL Building Standard v2, under the Air Concept (A05: Enhanced Air Quality) for all spaces, the following threshold must be met in occupiable areas: Formaldehyde: 9 µg/m³ or lower